


On September 21, the US market board looked great by every familiar measure. The Nasdaq Composite rose 2.26% to close at 27,122.09, an all-time closing high and its first record since June.Yahoo Finance The S&P 500 gained 1.49% to 7,764.70, less than 1% below its 52-week high.Yahoo Finance Semiconductors led the rally, with Intel up 12%, AMD up roughly 10%, and Qualcomm up more than 9%.
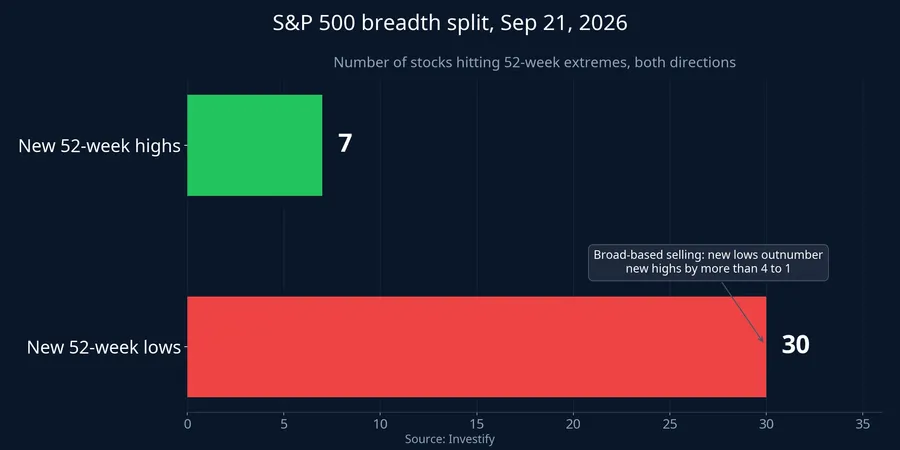
But in that very same session, 30 S&P 500 stocks fell to new 52-week lows while only 7 hit new 52-week highs.CNBC An index sitting just below its one-year high, with four times as many stocks touching one-year lows as one-year highs. That is a signal about the structure of capital flows, not something the headline number can tell you on its own.
Two precedents in nearly a century
Jason Goepfert, Founder of SentimenTrader and currently Head of Markets at NextGen News, points out that the last time the S&P 500 rose at least 1% to within 1% of its 52-week high while new lows outnumbered new highs was December 21, 1999, months before the dot-com bubble peaked.CNBC Before that, the only other instance in history was July 23, 1929.
Those two dates explain why Wall Street traders spent the session talking about it. But it's worth being precise here: two occurrences in nearly a hundred years do not make a statistical rule, and the signal itself does not predict where the market goes next. What it does is describe, accurately, a market state that's very hard to see if you're only reading the index number.
What market breadth actually measures
The S&P 500 and VN-Index are both cap-weighted, meaning the bigger the company, the more its price swings dictate the index. The result is that an index can close solidly green even when most of the stocks in the basket are red, as long as a handful of the largest names rise hard enough to carry the whole board.
Market breadth is the family of indicators that measures how many stocks are actually participating in that rally, and the most common versions come in two forms. The first counts advancing stocks against declining stocks within a single session. The second counts new 52-week highs against new 52-week lows, comparing over a one-year window instead of one day. When the index climbs while both of these counts fall, the rally is leaning on an increasingly narrow group of stocks.
Art Hogan, Chief Market Strategist at B. Riley Wealth, flagged exactly this during the September 21 session. The three sectors driving the S&P 500 that day were communication services, information technology, and consumer discretionary, but of the three, only information technology sat within 1% of its 52-week high; communication services was still 4% away and consumer discretionary a full 7% away.CNBC Even inside the leading group, internal health was uneven.
The names falling, and why the read needs caution
The list of stocks hitting 52-week lows isn't full of unknown names. As of September 18, 22 S&P 500 stocks were trading at one-year lows, including PepsiCo, McDonald's, Lowe's, Nike, Carnival, Las Vegas Sands, Clorox, and Lennar.Trefis Nike has lost 49.3% of its value over 12 months, Lennar 41.4%, Lowe's 26.7%, and McDonald's 16.5%.
This is exactly where interpretation needs care. The stocks hitting lows cluster in consumer goods, homebuilding, cruise lines, and casinos, sectors facing their own pressure from weak consumer spending, a higher-for-longer rate environment, and shifting consumption habits, not necessarily a sign of an index-wide bubble. The same data supports at least two readings: a market over-concentrating in a single technology theme, or a consumer economy slowing down while capital rotates into computing infrastructure. The evidence so far isn't enough to rule out the second reading.
A structural signal, not a timing signal
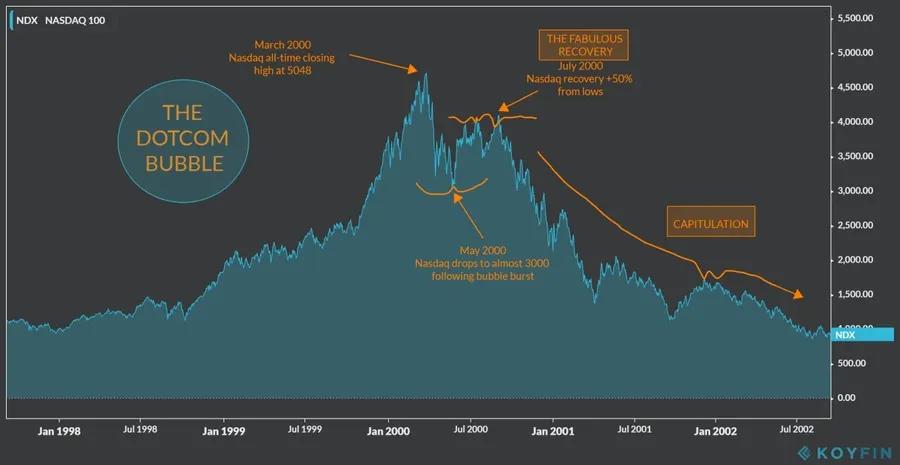
There's a part of the December 21, 1999 story that rarely gets repeated: the market kept climbing after that date. The Nasdaq Composite closed 1999 at 4,069.31 and didn't peak until 5,048.62 on March 10, 2000, nearly three months after the signal fired.Wikipedia The S&P 500 peaked even later, at 1,527.46 on March 24, 2000.Wikipedia Anyone who sold their entire portfolio the day the signal appeared missed a meaningful further rally, before the S&P 500 entered a roughly 30.5-month decline that erased 49.1% from peak to trough.
In other words, breadth divergence isn't a sell-timing tool. It measures dependency: how reliant the index is on a narrow group of stocks. When the group of stocks holding up the index shrinks, the headline number stops measuring the real risk of any specific portfolio. The better question becomes how much your own holdings overlap with the stocks actually pulling the index higher.
VN-Index is showing the same structure
Vietnamese investors don't need to look at the US to see this pattern. Take the past month exactly, from the August 20 session through September 21: VN-Index rose 3.77% and VN30 rose 3.51%, while VNMidCap fell 1.56% and VNSmallCap fell 1.33%. The headline index moved up almost entirely on the back of large caps, while mid- and small-cap stocks lost ground over the same stretch. Anyone holding mid- and small-cap names lived through a very different month than the 3.77% headline suggests.
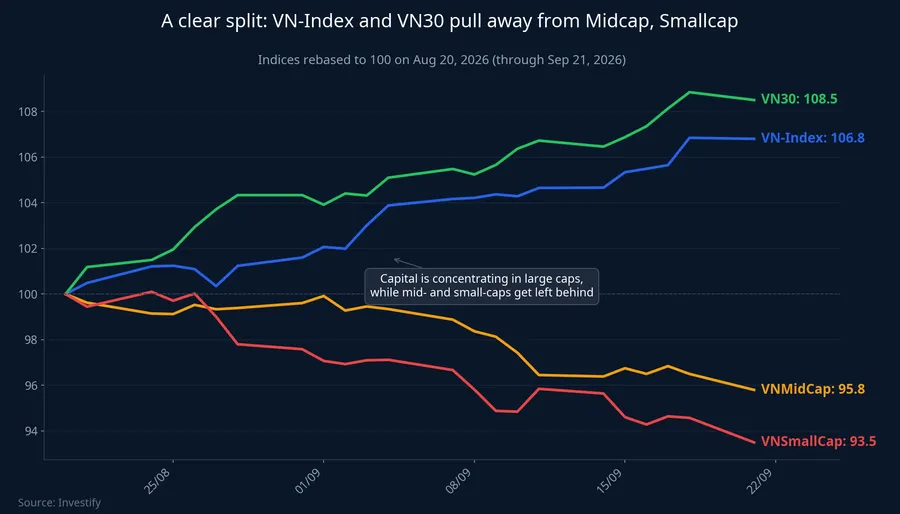
Breaking it down by session makes it clearer still. Of the last 20 VN-Index trading sessions, 12 closed higher. In 6 of those 12, decliners on HOSE still outnumbered advancers. Exactly half of the green sessions had red internals.
Two sessions illustrate the gap best. On August 21, VN-Index rose 1.95% with 245 advancers against 68 decliners; VNMidCap rose 2.95% and VNSmallCap rose 1.49%. On September 4, VN-Index also rose sharply, up 1.39%, but only 122 stocks advanced against 173 decliners, and both VNMidCap and VNSmallCap closed in the red. On the closing summary, both sessions show up as the same positive number. Underneath, they were two different markets.
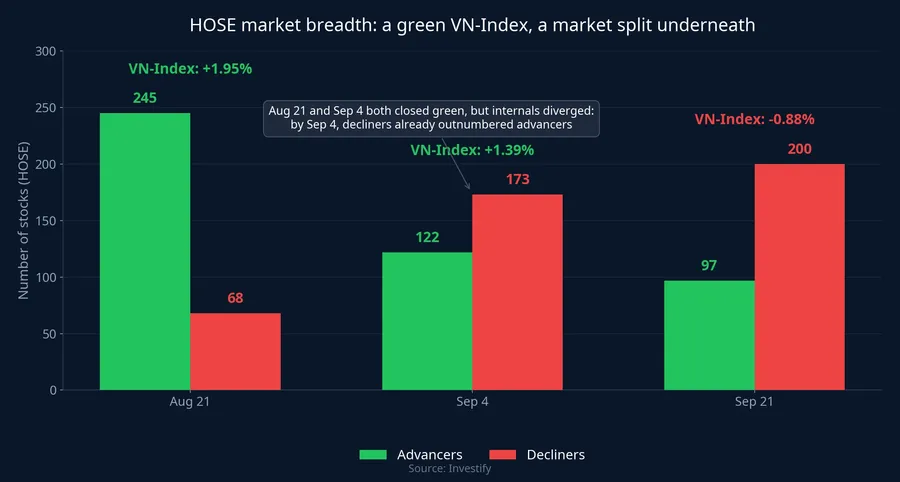
In the most recent session, September 21, VN-Index closed at 1,799.67, down 15.99 points or 0.88%, with 97 advancers against 200 decliners. After a month led almost entirely by large caps, this pullback session was broader than a typical up session, too.
Reading the index in full

For individual investors, the takeaway isn't to buy or sell, it's to add two habits to your daily reading, both free on any standard price board.
First: after reading VN-Index's percentage move, check the advancer-decliner count for the exchange. A green index with decliners dominating means the rally is being carried by a small group, not broad-based buying.
Second: place VN-Index next to VNMidCap and VNSmallCap over the same window. All three moving together means capital is genuinely spreading out. All three diverging means your portfolio's correlation with the VN-Index headline is lower than you'd assume, and the sense of safety from a green index may not reflect what's actually happening to the specific stocks you hold.
Signals worth watching in the sessions ahead: whether HOSE breadth improves as VN-Index continues to climb, and whether the gap between VN30 and VNMidCap/VNSmallCap narrows or keeps widening.