


If you only look at the headline number from the morning of August 25, the picture looks great: the VN-Index closed the morning session at 1,807.11 points, up 18.33 points, or 1.02%, on trading volume of nearly 390 million shares. The index had just cleared the 1,800-point level that analysts had been watching for two weeks.
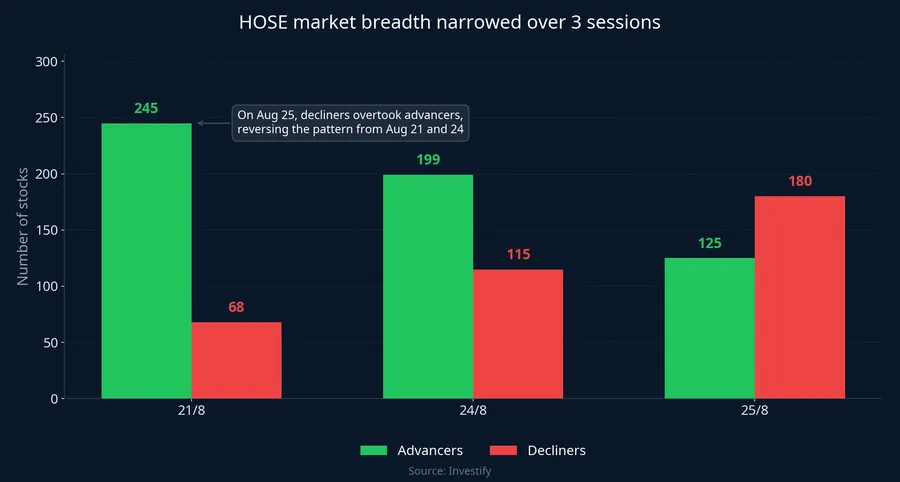
But open the price board and count the green and red tickers, and the picture looks very different. That same morning, HOSE recorded 125 advancing stocks and 180 decliners, meaning for every stock that rose, roughly one and a half fell. These two numbers are not contradicting each other; they are simply measuring two different things. Understanding that difference is how you avoid misreading a market headline, even one that is perfectly accurate.
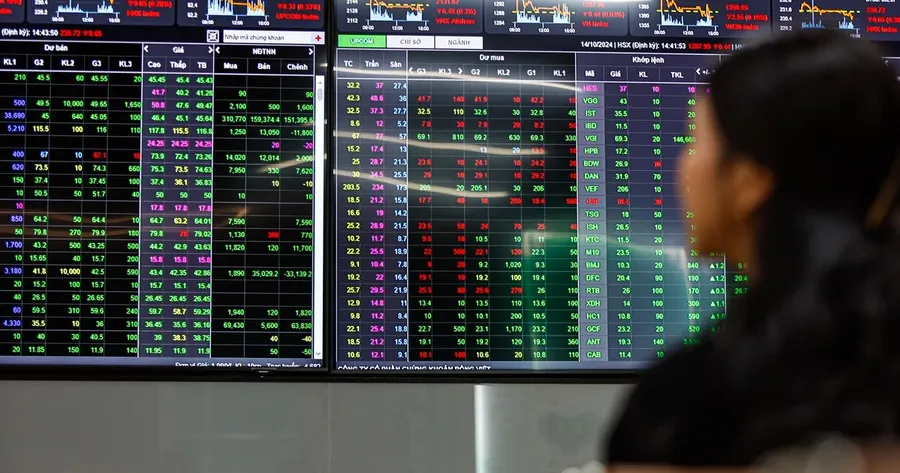
An index measures money, not stock count
Put simply, the VN-Index is not an average of how every stock on the exchange performed. It is a market-cap-weighted index: HOSE sums the market value of all listed shares, adjusted for free-float ratio, then compares today's total capitalization to a base-period value.
Think of it like a grocery basket weighed by total value, not counted by number of items. A company worth trillions of dong and a company worth thousands of billions can both rise 1%, yet their contribution to the index differs by a factor of a thousand, even though the number of stocks rising or falling is exactly what individual investors feel most directly when they open their own accounts.
Why one stock can carry an entire index
On the morning of August 25, VIC rose 4.71% to VND 224,600 a share, pushing its market cap to VND 1.73 quadrillion (1,730.8 trillion). VHM also contributed, rising 2.04% to VND 74,900, with a market cap of VND 307.6 trillion.
That VND 1,730.8 trillion figure only means something next to the rest of the market. The second-largest stock on HOSE by market cap is VCB, at VND 498.8 trillion, meaning VIC alone is nearly 3.5 times larger than the stock ranked right behind it.
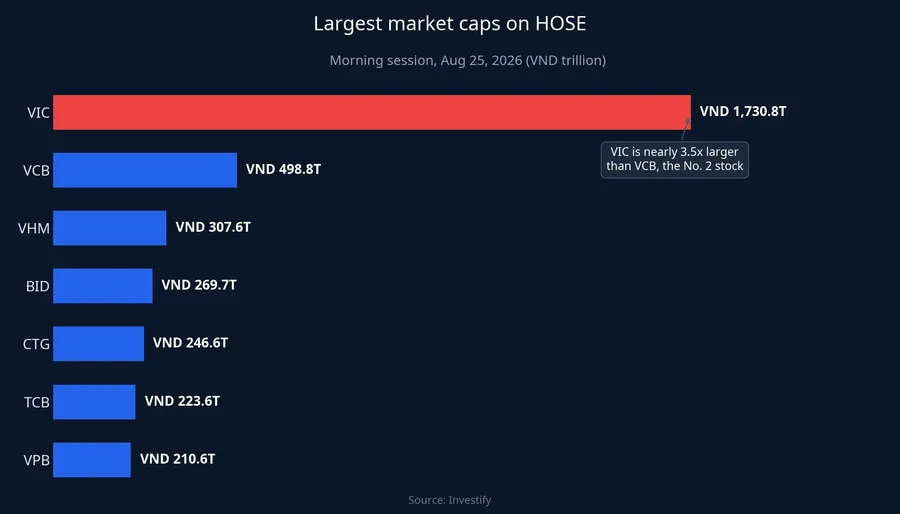
The morning's math makes the point even sharper. VIC's market cap rose by roughly VND 77,900 billion compared with the August 24 close. For context, the entire market cap of VRE, the company that runs the Vincom mall chain, is VND 58,100 billion. In other words, the value one stock added in half a morning was larger than the entire value of another listed company.
Flip it around: a stock worth VND 5,000 billion hitting its 7% daily ceiling would add only VND 350 billion to total market cap. To offset what VIC added this morning, the market would need more than 200 stocks that size to all hit their ceilings in the same session. That is exactly why a handful of the largest stocks carry outsized weight on the board.
This morning's rally did not come from Vingroup stocks alone. Several bank stocks contributed too: VCB rose 0.84%, LPB rose 2.24%, VPB rose 0.76%, and BID rose 0.41%. But at the same time, GAS fell 2.12%, HPG fell 0.90%, and MSN fell 0.57%, showing that even the blue-chip group was split. What kept the index deep in the green was the outsized weight of a few of the largest stocks, not agreement across the board.
Four baskets, four different answers
The quickest way to check this is to look at HOSE's other indices, which group stocks by market-cap size. In the same August 25 morning session, the VN-Index rose 1.02%, VN30 (the 30 largest stocks) rose 0.65%, VNMidCap (mid-cap basket) fell 0.04%, and VNSmallCap (small-cap basket) fell 0.24%.
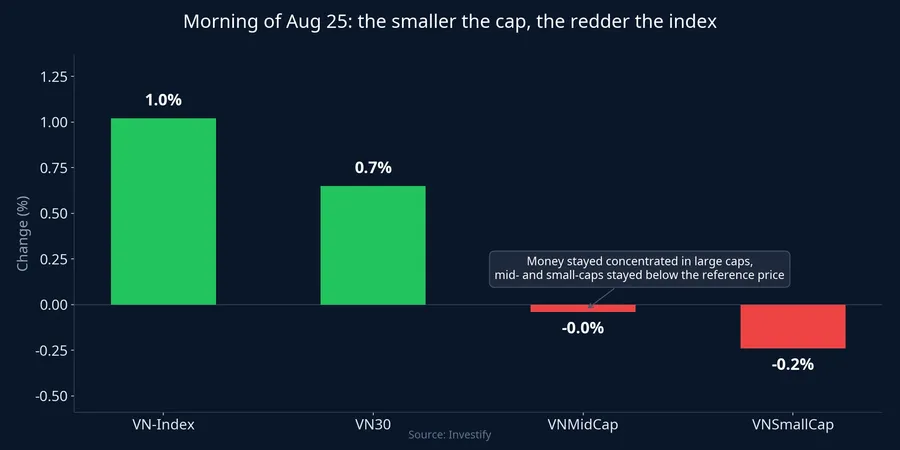
If you hold mid- and small-cap stocks, the group familiar to many retail investors, this morning you saw your own basket sitting below the reference price while the headline read that the VN-Index gained more than 18 points. That mismatch is not a misread on your part; it reflects two different yardsticks answering two different questions.
Notably, the two previous sessions did not look like this. On August 24, the VN-Index rose 20.66 points with 199 advancers versus 115 decliners, while VNMidCap rose 0.83% and VNSmallCap rose 0.65%. August 21 was even broader, with 245 advancers versus just 68 decliners. In other words, the character of the rally shifted right within the morning of August 25, even though the index's color stayed the same.
A pattern that repeats regularly
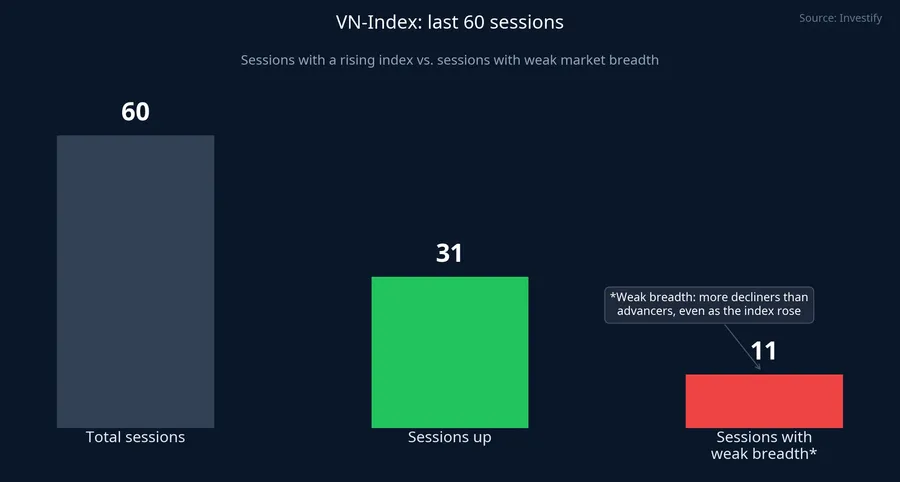
A 60-session look-back shows the VN-Index rose in 31 sessions, but 11 of those had more decliners than advancers, meaning more than a third of the index's green sessions were not accompanied by a genuinely green market.
Two sessions in April show how wide that gap can get. On April 22, the VN-Index rose 23.82 points (1.30%), yet 192 stocks fell versus just 101 that rose. Per Dân Việt, VIC alone hitting its daily ceiling contributed more than 23 points that day, meaning almost the entire session's gain came from a single stock. April 16 was even more skewed: the index rose 19.18 points with 98 advancers and 212 decliners, while VnEconomy reported that VIC and VHM together contributed 27 points, more than the index's total gain, meaning the rest of the market actually subtracted nearly 8 points.
More recently, Thời báo Tài chính Việt Nam noted that the August 24 gain still depended heavily on large-cap names, especially VIC and VHM. Vietcap Securities, cited by Tuổi Trẻ, likewise noted that buying demand in most other sectors remained fairly selective.
Narrow breadth is not automatically a bad signal
Resist the urge to jump to a negative conclusion too quickly. A session where the index rises on narrow breadth can have several different explanations, and not all of them are concerning.
Money could be concentrating around a specific story at a large company, such as earnings news or a new project, rather than exiting the market altogether. This could also just be normal profit-taking in mid- and small-caps after three straight up sessions from August 21 to 25. And the data here only covers a single morning; market breadth often shifts in the afternoon session as trading volume piles up toward the close. There isn't enough data here to say which explanation dominates, only that the rally's reach narrowed compared with the two prior sessions.
What the data can say for certain is how widely a rally is spreading, not where the market goes next. Breadth tells you how many stocks a rally rests on, and a rally resting on a handful of names depends more heavily on those same names holding up.
How to read an index headline correctly
For new investors, a few reading habits help avoid misreadings. First, look at the advancer and decliner counts right next to the index number; every brokerage price board displays these two figures, and they answer the question the index number cannot: how many stocks actually gained. Second, match your benchmark to your portfolio: if you hold mostly mid- and small-cap names, compare against VNMidCap or VNSmallCap rather than the VN-Index, which is dominated by a few giant stocks. Third, separate out the blue-chip contribution when judging a session: market recaps usually publish lists of stocks pulling the index up or down, and if one or two names account for most of the gain, that is a rally for those stocks, not yet a rally for the market.
The signal worth watching in the afternoon session of August 25 and the sessions ahead is whether breadth improves. If the VN-Index holds above 1,800 points and advancers overtake decliners again, the rally gains a broader foundation. If the index stays green while VNMidCap and VNSmallCap stay red, most retail portfolios will keep diverging from the number on the headline, and that is when it pays to look at your own price board rather than the index alone.