
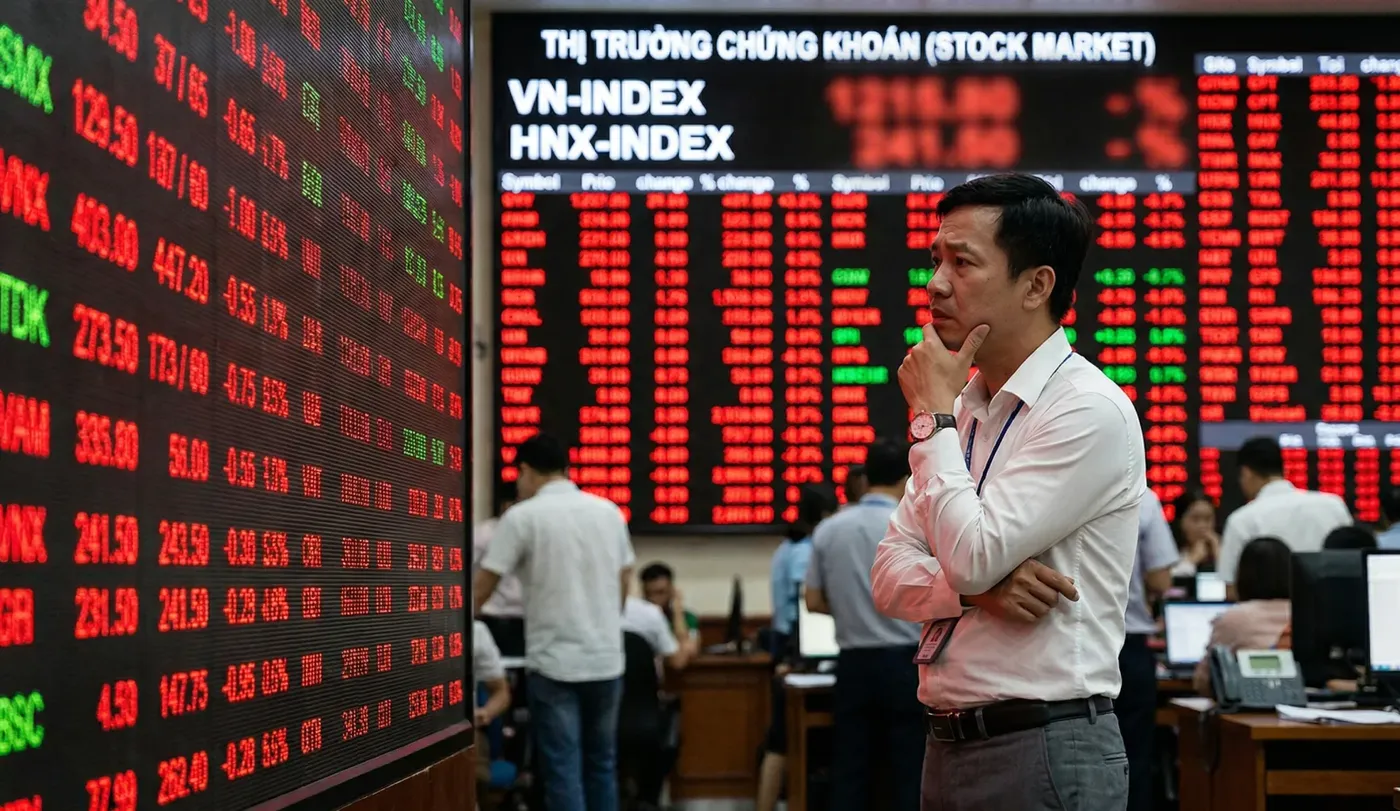

VN-Index lost 64.10 points over August 13 and 14, ending the latter session at 1,729.08. After a decline of that size, investors often rush to call a bottom: those holding cash see lower prices and want to buy, while those holding shares want to sell before the slide extends. Neither lower prices nor a single green session, however, proves that the market has stabilized.
Think of the index as a thermometer for the market. Breadth, the behavior of the large stocks weighing on the index, and liquidity are the checks that show whether the patient is genuinely recovering or merely running a lower fever. This is not a forecast for the August 17 session. It is a practical framework for newer investors who want to judge the quality of a rebound before drawing conclusions.
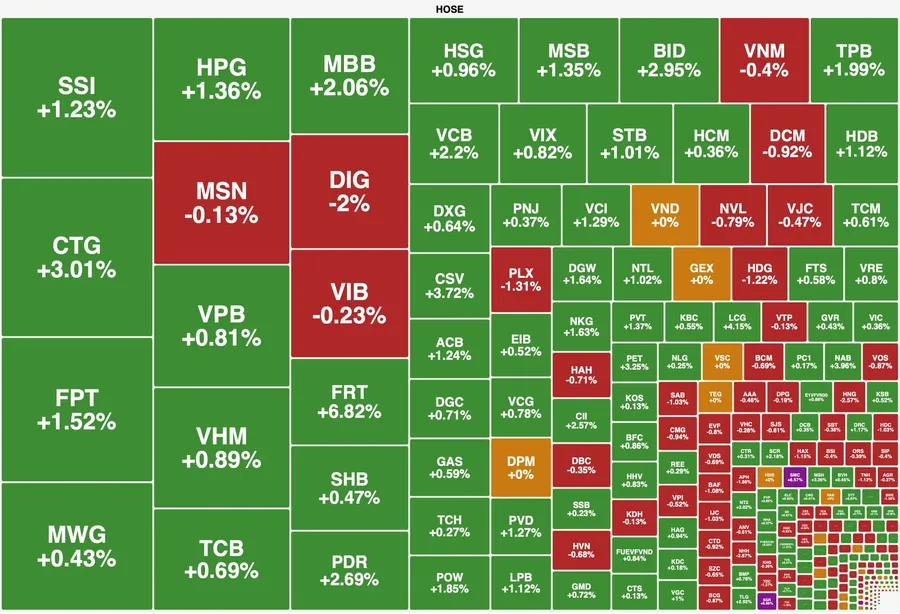
A positive day does not settle the story
On August 14, VN-Index fell 36.55 points, or 2.07%. HOSE recorded 64 advancers against 278 decliners, with more than 737.5 million shares traded. That combination suggests that selling pressure reached well beyond a few isolated names.
The end of July offered two very different examples of what can follow a sharp fall. VN-Index dropped 62.03 points on July 22 and gained 30.85 points the next day, only to fall another 13.27 points and 17.10 points over the following two sessions. By contrast, the index rose for three consecutive sessions from July 28 to July 30, while daily breadth tilted toward gainers. Recent history cannot predict the next session, but it does show why one green candle should not be treated as confirmation of a new trend.
Rather than asking whether the bottom is in, it is more useful to ask where demand is appearing and whether it lasts into the close. The following signals are not a fail-safe formula. They are a way to take some emotion out of decisions during a volatile session.
Breadth needs to become less one-sided
Market breadth is simply the balance between rising and falling stocks. It answers a question close to an investor's lived experience: is a portfolio recovering with the index, or are only a handful of heavyweight shares lifting it? On August 14, HOSE had more than four decliners for every advancer. That is a difficult starting point for any rebound.
The next session does not need gainers to dominate from the opening bell. A more useful first sign is that the gap between advancers and decliners narrows through the open, late morning, and close. If advancers approach or exceed decliners at the end of the day, buying has spread beyond a small group of index heavyweights.
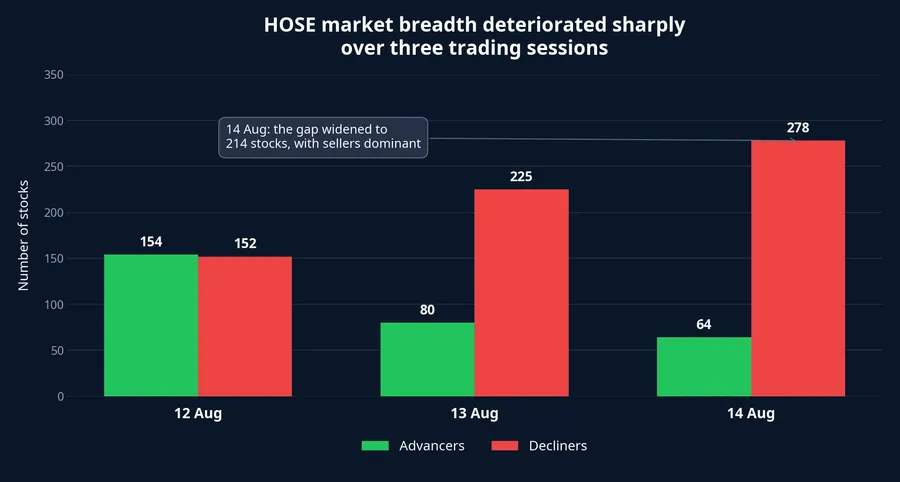
It is important not to combine figures covering different universes. A Vietstock midday report on August 14 counted 434 decliners and 184 advancers across the whole market, while the closing figures of 64 advancers and 278 decliners cover only HOSE.Vietstock Both sets show broad weakness, but they cannot be used to calculate the change in the same basket of stocks. Before comparing numbers, investors should identify the market segment and point in time that each number measures.
An index gain alongside persistently narrow breadth deserves caution. It may simply reflect the influence of large-cap shares while most portfolios remain under pressure. Breadth that improves into the close still does not guarantee a trend reversal, but it provides a broader base worth tracking over subsequent sessions.
Watch the stocks creating the pressure
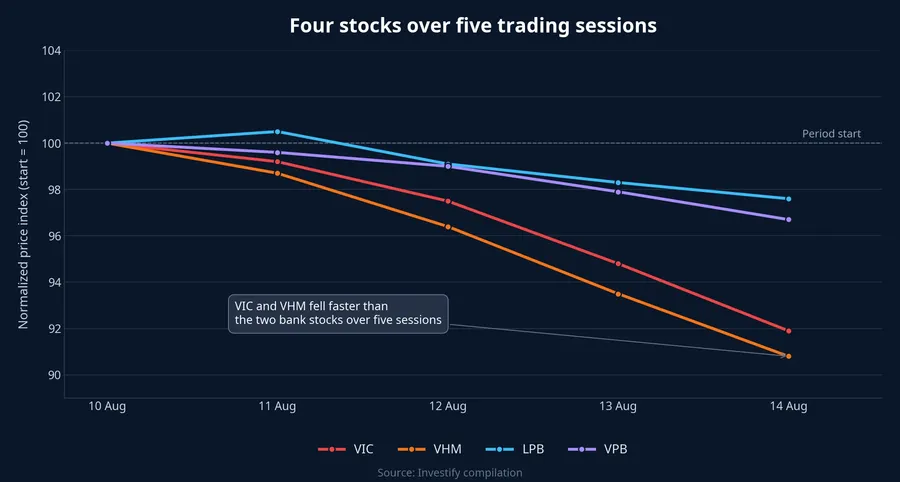
An index is weighted, so movement in a few large companies can make the overall picture look better or worse than the rest of the market. By late morning on August 14, Vietstock estimated that VIC and VHM alone had removed more than 8 points from VN-Index.Vietstock At the close, VIC was down 3.85% at VND 199,900 and VHM was down 4.32% at VND 68,700. LPB fell 2.42% and VPB declined 1.78%.
The August 17 test is not whether all of those shares turn positive. A more constructive sign would be for VIC and VHM to stop falling sharply together, while selling across banks and securities companies becomes less widespread. When the groups that were jointly pressuring the index stop making new intraday lows, the index has a better chance of reflecting a more balanced market.
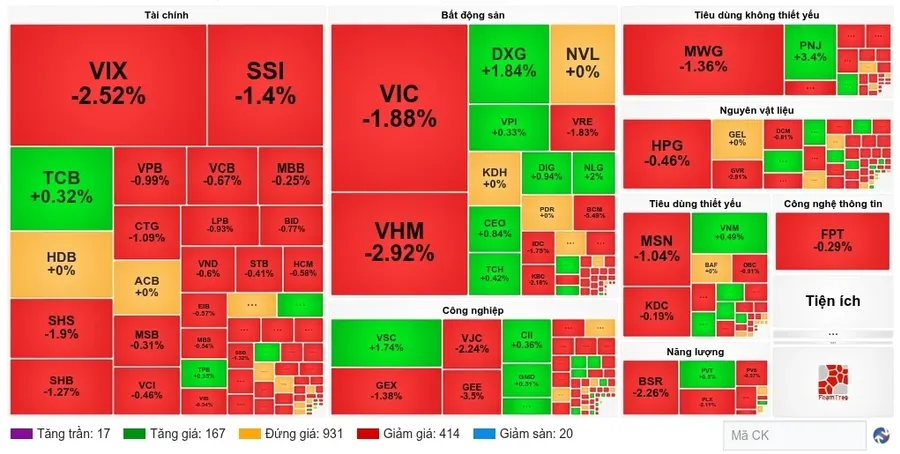
Still, one session of price data does not establish the cause of every move. Profit-taking, risk controls, foreign-investor transactions, and broader market conditions can all overlap. The available data identify which groups are weighing on the index; they do not allocate the exact contribution of each possible driver.
The normalized chart below illustrates the difference in five-session performance. VIC and VHM fell faster than LPB and VPB. That is why the index alone is not enough: investors need to see which groups are changing before deciding whether a green index reflects a broader improvement.
Liquidity matters only alongside price and breadth
More than 737.5 million shares traded on August 14, close to 743.4 million on August 13 and above 570.6 million on August 12. Heavy turnover during a decline means many shares changed hands at lower prices. It does not, by itself, tell us whether buyers prevailed or sellers ran out of stock.
The three pieces have to be read together. If VN-Index rebounds, advancers broaden, and volume accumulates faster at the same point in the day, buying is becoming more visible. If the index turns green only to be pushed back down while volume rises, sellers may still be accepting lower prices to exit. If the index rises on light volume and narrow breadth, sellers may simply be pausing.
Liquidity comparisons also need a like-for-like basis. Morning volume should not be compared with the entire previous day's volume and labelled weak or strong. Compare the same time of day first, then check total turnover after the close. This discipline helps prevent premature calls when intraday direction can change quickly.
On July 23, more than 862.7 million shares traded and breadth showed 189 advancers against 122 decliners, yet the market fell again over the next two sessions. Even when all three signals improve on one day, persistence remains the missing confirmation. The market needs time to demonstrate that demand is more than a one-session appearance.
A compact checklist for August 17
The order of observation can be simple. First, see whether breadth improves into the close. Next, check whether VIC, VHM, and financial stocks are still falling together or are applying less pressure. Finally, read liquidity alongside the direction of prices and breadth, rather than as an isolated turnover figure.
The central point is that a rebound becomes more credible when all three signals improve together. If the index is green but breadth remains narrow, the pressure groups keep falling, and volume rises as prices slip, the evidence for a better supply-demand balance is still insufficient. The next useful question after August 17 is whether any improvement carries into the sessions that follow.