

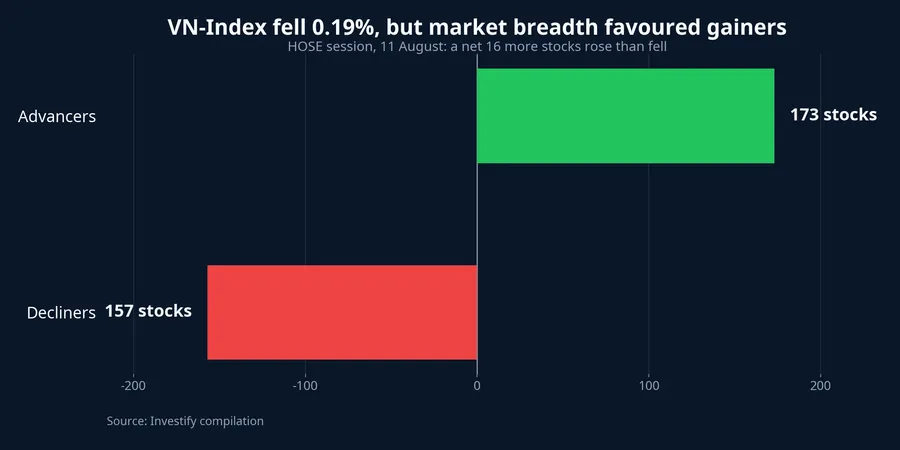
The VN-Index closed 11 August down 3.36 points, or 0.19%, at 1,773.41. Yet 173 stocks advanced on HOSE while 157 declined. Those figures describe the same trading session, but not the same thing: the headline index was under pressure, while the broader list of stocks was not uniformly weak.
For new investors, that distinction matters. The VN-Index is a useful market thermometer, but it is not a report card for every portfolio. To judge whether a red session is broad-based, place the index alongside market breadth, the behaviour of large-cap stocks, and trading volume.
The index does not give every stock an equal vote
Think of the VN-Index as a weighted scale rather than an election in which every stock has one vote. A company with a larger market capitalisation carries more weight in the calculation. A small group of large stocks can therefore pull the index lower even when more individual shares are gaining than falling.
VCBS's summary of the index methodology describes VN-Index as a comparison between current and base-period market capitalisation. That construction gives price moves in larger companies greater influence on the aggregate result.VCBS Breadth answers a different question: how many stocks rose and how many fell, regardless of their size.
Neither measure is wrong, and neither is sufficient on its own. The index is useful for tracking the direction of large-cap value on HOSE. Breadth tests how widely gains or losses are spreading. Reading just one can turn a mixed session into an overly simple conclusion.
This is why a portfolio can feel different from the headline. An investor holding mostly smaller companies may have seen more green than the VN-Index suggested. An investor concentrated in banks and other heavyweights may have had the opposite experience. The index remains important, but it cannot replace a look at the actual mix of stocks that is driving a session.
Large caps put pressure on the headline number
Several large bank stocks declined on 11 August. VCB fell 0.83% to VND 59,800, BID lost 1.01% to VND 39,100, and CTG slipped 1.52% to VND 32,300. VPB fell 1.35% to VND 25,500, TCB declined 1.44% to VND 30,900, while GAS dropped 2.88% to VND 77,500. When several large-cap names move lower together, their combined impact can outweigh the number of stocks that are rising.
That list should not be treated as a formal point-contribution table. Without the daily weights and contribution data for each constituent, it would be inaccurate to assign a precise number of lost points to a particular stock or sector. The evidence supports a narrower conclusion: pressure came from several large-cap names, not that one stock or one industry explains the whole index move.
There were offsets. VIC was unchanged at VND 208,500 and VHM rose 0.70% to VND 72,100. They helped soften the pressure but did not return the index to positive territory. The more accurate picture is not that every heavyweight fell; losses in several heavyweights outweighed the support elsewhere.
Positive performance was more visible below the largest names
The size-based indices make the split clearer. VN30 fell 0.14% to 1,922.53, while VNMidcap gained 0.05% to 1,950.93 and VNSmallcap rose 0.16% to 1,267.66. That is evidence of size-based dispersion during this particular session.
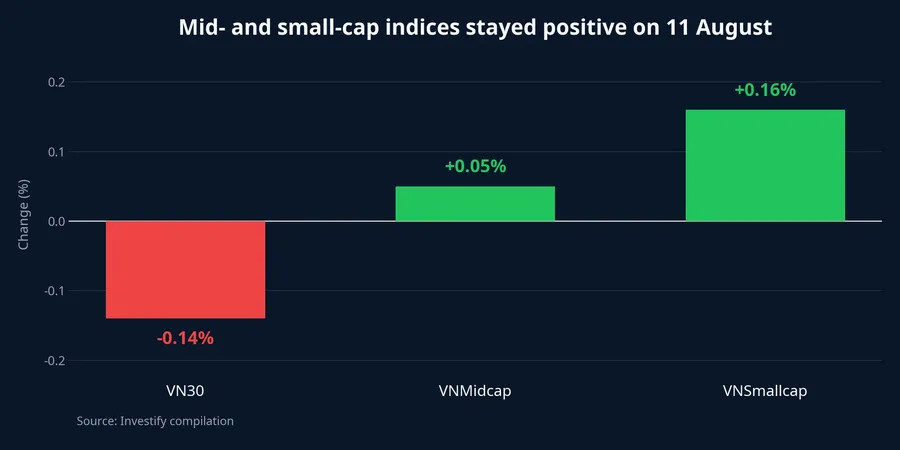
Still, “mid- and small-caps rose” needs careful interpretation. VNMidcap gained even though it had 28 advancers and 33 decliners. VNSmallcap recorded 98 gainers and 78 losers. These are weighted indices too, so a positive index does not mean every constituent rose, or even that most shares made a meaningful gain.
VN30 looked weaker, with 9 gainers and 18 decliners. Taken together, the figures show pressure concentrated more heavily in the large-cap layer while the mid- and small-cap universe held up better. That is more informative than saying simply that “the market fell.”
It also guards against a common mistake: turning a positive breadth figure into a blanket claim that conditions are easy. A stock can rise while its group remains fragile, and a weighted index can rise even when decliners outnumber advancers. Breadth and index performance are complementary checks, not competing verdicts.
Volume is the next test
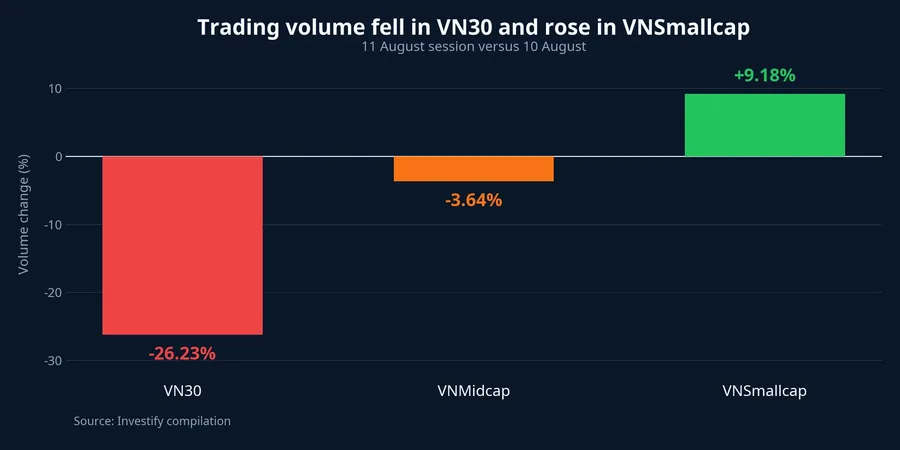
If capital is genuinely rotating from large to small stocks, the pattern should leave a volume trail and persist beyond a single session. Total matched volume on HOSE was 640,887,832 shares on 11 August, down 12.30% from the previous session. With activity down across the exchange, it is premature to call this a strong rotation.
By size group, VN30 volume fell 26.23% to 247,811,838 shares. VNMidcap volume eased 3.64% to 291,964,657 shares. VNSmallcap was the exception, with volume up 9.18% to 85,837,767 shares. The contrast suggests that trading tilted further toward smaller names during the session, but one increase in volume does not establish a durable trend.
Other explanations remain plausible. Investors may have taken profits in large caps that had risen earlier, energy names may have paused after a strong move, or short-term demand may have found smaller stocks. The available data do not allocate turnover by sector and ticker, so they cannot identify one explanation as the decisive cause.
That uncertainty is not a weakness in the analysis; it is a limit of the evidence. Calling every difference in volume a capital rotation would turn an observation into a causal claim. A more useful habit is to ask whether the pattern repeats, whether it broadens across sectors, and whether prices and turnover continue to point in the same direction.
Use two layers of evidence for the next session
The 12 August session should be read through two separate questions. First, does exchange-wide breadth remain tilted toward gainers? If advancers stay ahead and VNSmallcap volume remains above its prior baseline, the positive tone outside the large caps gains support. If breadth quickly deteriorates, the 11 August support may prove temporary.
Second, do large caps stop adding pressure? VN30 does not need a strong rally to make the market less skewed. It would be enough for large names to stop weakening together while breadth remains constructive. If VN30 keeps falling and decliners also become more numerous, the story would shift from dispersion to broader weakness.
There is a practical sequence for reading the board after the close. Start with the VN-Index, then compare advancers and decliners. Next, check whether VN30, VNMidcap, and VNSmallcap are moving together or separating. Finally, look for the group where volume is increasing. The sequence does not predict the next session, but it makes it harder to mistake a weighted headline for a complete picture.
The appropriate conclusion from 11 August is that the market was not broadly declining, but the evidence is also insufficient to confirm a durable rotation. For F0 investors, treat the VN-Index as the start of the analysis. Breadth, large-cap behaviour, and the location of rising volume show whether a red headline genuinely represents most stocks in a portfolio.