

Sometimes a trading screen appears to tell two conflicting stories. A portfolio holding VHM is clearly down, yet the market headline says the VN-Index rose. The 7 August session offered a clean example: the VN-Index finished at 1,768.06, up 3.28 points or 0.19%, while VHM fell 5.32% to VND 73,000.
There is no contradiction. The VN-Index measures the change in market value across its constituent shares, while an investor's result depends on the specific holdings and weights in that investor's portfolio. The useful reading of this session is straightforward: positive breadth helped the index absorb VHM's decline, but the advance was small and still relied materially on large-cap support. That is something to examine, not confirmation of a broad-based uptrend.
The index is not a mirror of one stock
Think of the VN-Index as a large set of scales. Every stock sits on it with a different weight, driven chiefly by market capitalization. When a large company moves, its side of the scales changes more than that of a smaller company moving by the same percentage.
But one heavy object moving down does not automatically pull the whole scale lower. Gains in many other holdings can offset it. That is what the 7 August session illustrates. A component snapshot taken near the closing auction estimates that VHM removed about 2.9 index points. It is best read as a relative indicator rather than added mechanically to the official index move, because the component observations may not be captured at precisely the same moment.
That limitation is also a useful warning about “point contributors” tables. They identify where to look, but they do not replace the full index calculation. For newer investors, the safer habit is to treat them as a map rather than a calculator that can explain every tenth of a point.
Where the offsetting support came from
Several strong gainers set the tone. GAS rose 6.88% to VND 74,600, GVR gained 6.82% to VND 29,750, BCM added 6.93% to VND 38,600, and SZC rose 6.89% to VND 19,400. Their gains were close to the daily price limit, but a percentage move does not translate one-for-one into index impact because their market capitalizations differ.
The component snapshot estimates that these four names together contributed only about 0.6 points. They supported sentiment and showed that buying interest reached stock-specific stories, yet they could not on their own offset VHM's drag. Looking only at the day's biggest percentage gainers would miss the rest of the picture.
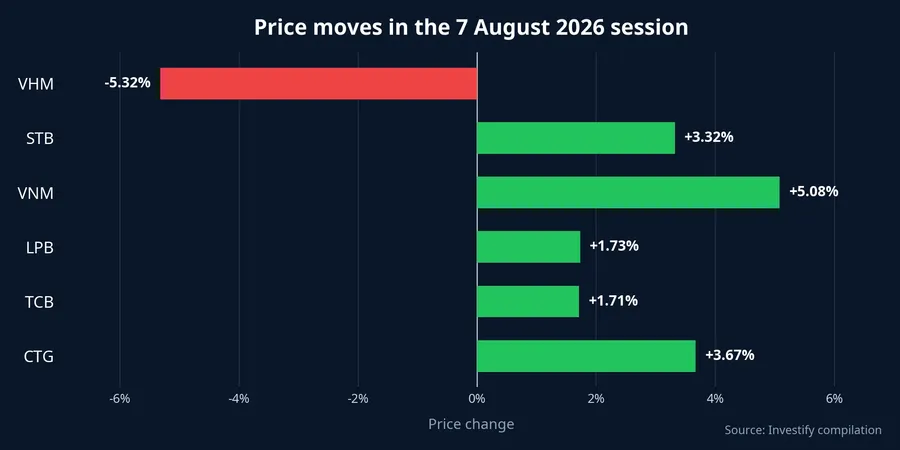
More consequential support came from banks and consumer shares. STB gained 3.32% to VND 74,600 and VNM rose 5.08% to VND 62,000. LPB added 1.73% to VND 52,900, TCB rose 1.71% to VND 29,700, and CTG gained 3.67% to VND 32,500. The individual moves were different, but their size and the gains elsewhere on the exchange helped keep the index above its prior close.
This draws an important distinction. “Biggest gainers” describes percentage price changes. “Largest index contributors” describes total impact after weight is considered. BCM or SZC can be near their ceiling, while a bank up a little over 1% can matter more to the VN-Index. They answer different questions and should not be used interchangeably.
Breadth says the advance extended beyond one pillar
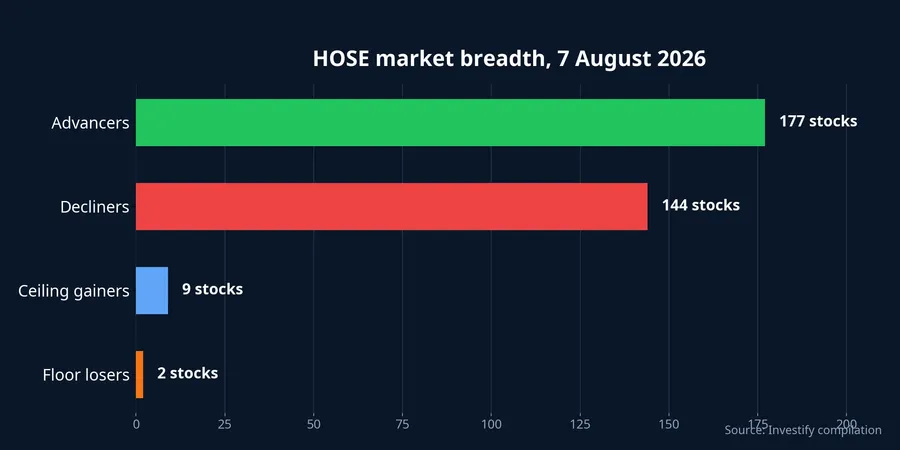
HOSE ended with 177 advancing stocks and 144 declining stocks, alongside 9 ceiling gainers and 2 floor losers. The 33-stock advantage for advancers is direct evidence that the green close was not created by a single index heavyweight.
Market breadth is like counting how many people are walking in the same direction instead of watching one person move very quickly. More winners than losers means buying appeared in more places than selling. It does not, however, measure the size of each move. A stock up 0.1% counts exactly the same as a stock at its daily ceiling, so breadth needs to be read with price moves and turnover.
The VN-Index recorded matched volume of 647,697,546 shares. That is meaningful activity, but a single turnover number cannot prove that fresh money is entering strongly or that the rise is durable. It needs a like-for-like comparison with an average across prior sessions. Without that comparison, the defensible conclusion is that buying broadened by number of stocks, while the durability of that buying still needs confirmation.
Broad participation or a leadership rotation?
The session had elements of both. Advancers outnumbered decliners, so the market was not simply swapping VHM for one other pillar. At the same time, the index-level support remained concentrated in STB, VNM, LPB, TCB, and CTG, names large enough to make a visible difference to the benchmark.
That is why two investors can experience the same session so differently. A VHM holder saw a sharp loss. An investor holding banks, VNM, or strong gainers tied to infrastructure and industrial parks may have seen a better result. The VN-Index compresses those different experiences into a 0.19% increase; it cannot stand in for every portfolio.
It would be premature to assign the green close to one single cause. Rotation among large-cap groups, buying after earlier moves, and company-specific developments could all be involved. The available evidence supports one point most clearly: gains across many shares absorbed VHM's pressure. It does not isolate the contribution of each driver or establish a new market-wide inflow trend.
What to check in the next session
The first signal is breadth. If advancers continue to outnumber decliners and turnover improves against its recent baseline, the case for broader participation strengthens. If the index is green while decliners regain the majority, the market may be leaning on a narrower set of large caps.
The second is follow-through among the index supporters. STB, VNM, LPB, TCB, and CTG do not all need another large rise, but buying needs to remain steady enough for them to continue offsetting pressure. For GAS, GVR, BCM, and SZC, the question is not only whether prices rise again; it is whether turnover holds after a strong session. Follow-through is what shows whether the market accepts a higher price range or merely reacted briefly.
The third is pressure from VHM and other weakening large caps. If VHM stabilizes, the rest of the exchange does not have to expend as much strength to offset it. If VHM continues to decline sharply, the VN-Index can still rise, but the conditions become harder and the benchmark becomes more dependent on a handful of large names.
The 7 August session does not mean that “the market is healthy because VHM fell and the index rose.” It says something more precise: positive breadth helped the VN-Index absorb VHM's decline, but the gain was thin and not independent of large-cap support. In the sessions ahead, breadth, turnover, and continuing buying in leadership stocks are the three signals that can show whether this green close is expanding into wider participation or merely shifting among pillars.