


At first glance, 4.1% looks reassuring: the US unemployment rate edged down from 4.2% in July. Yet the same report showed nonfarm payrolls falling by 23,000. That is not a contradiction, nor is it evidence that the labour market has become healthier. It is a reminder to examine the labour force, the denominator beneath the unemployment rate.AP
The key is that 264,000 people left the labour force during the month, taking the participation rate down to 61.4%. Someone without a job who is no longer actively seeking one is not counted as unemployed under the official definition. The rate can therefore decline even when employers are not expanding hiring.AP

Two surveys answer different questions
Think of one measure as counting jobs and the other as classifying people. Nonfarm payrolls largely come from a survey of employers and their payroll records. It counts job positions, so a person holding two jobs can appear twice in the series. Self-employed workers, by contrast, are not its central focus.
The unemployment rate comes from a household survey. It asks individuals whether they have work, are available for work, and are actively looking for it. Only people meeting all of those conditions belong in the unemployed group. A person who stops searching leaves both that group and the labour force, even if their income situation has not improved.
That distinction is why a 23,000 decline in payrolls should not be compared mechanically with the change in the number of unemployed people. One series measures positions on payrolls; the other categorises people. Sampling variation, seasonal adjustment and shifts in self-employment can also pull the two measures in different directions in any single month.
A smaller denominator changes the reading
The unemployment rate is a simple division: unemployed people divided by the labour force. The labour force includes those in work and those without work who are still looking. Not every fall in the rate therefore carries the same message.
When a job seeker retires, starts studying, cares for family, or pauses a search, that person leaves both the numerator and the denominator. If enough people do so, the unemployment rate can fall. In July, the labour force contracted and the participation rate reached its lowest level since February 2021.AP
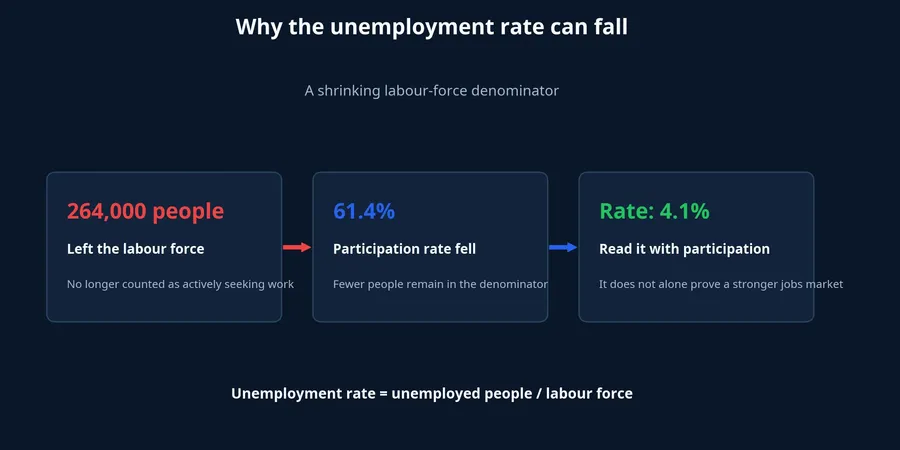
That does not mean all 264,000 people were discouraged workers. Retirement, education and family care are all plausible reasons for leaving the labour force, and the headline report does not assign each person a motive. The evidence does support a narrower, more useful conclusion: the lower unemployment rate is not an independent sign that hiring has improved.
For readers new to macro data, the participation rate is like checking how many people are still in a queue before deciding the queue is moving faster. A shorter line may reflect better service, but it may also reflect people leaving. That is why the unemployment rate should always be read alongside participation and payrolls.
Revisions reset the recent picture
Monthly payroll figures are first estimates, not final counts. As more employer responses arrive, the statistical agency revises earlier months. This is a normal feature of fast-release data: the market gets an early reading, then a fuller picture as the sample becomes more complete.
This time, May payroll growth was revised from 129,000 to 63,000 and June from 57,000 to 20,000. The combined downward revision was 103,000 jobs. Those changes make the pace of job creation before July look weaker than the initial releases suggested.AP
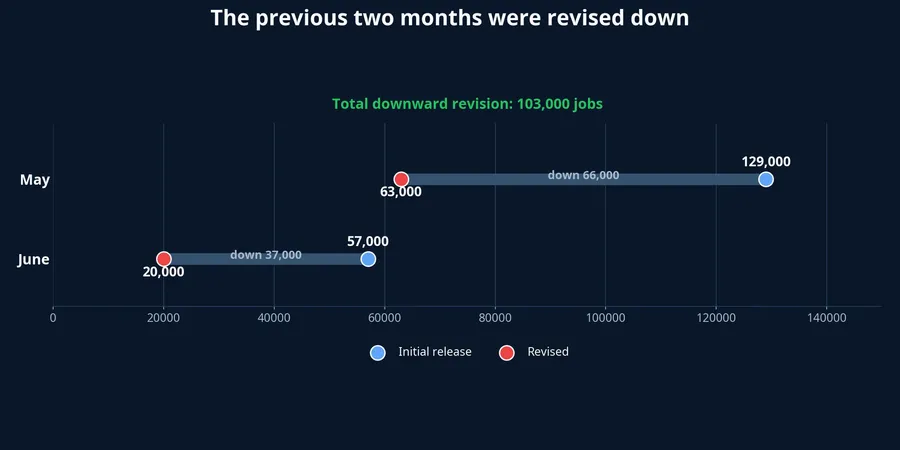
The direction of revisions matters more than any isolated headline. With both prior months revised lower, it is less convincing to dismiss the 23,000 payroll decline as random noise. Even so, the revisions do not establish that the US economy will enter recession. Seasonal noise, late reporting and statistical variation remain plausible contributors to the movement.
The evidence points to a cooling labour market, not to a complete answer about the pace or endpoint of that cooling. That distinction separates data analysis from a rushed conclusion. One weak month does not define a cycle, but several months moving in the same revised direction belong in a wider assessment.
Revisions also change how a reader should react to the first number on release day. An initial payroll figure is valuable because it is timely, not because it is immutable. Treating it as a final verdict can create false confidence in either direction. A more durable read asks whether the next releases confirm the first signal and whether the revisions strengthen or weaken the preceding trend.
This does not make the payroll survey less useful. It makes the time horizon explicit. The initial report is an early photograph; subsequent revisions provide a sharper image. Investors who separate those two roles can react to new information without turning every monthly surprise into a claim about the whole economy.
Investors should follow a sequence, not a headline
Labour indicators can move expectations for the Federal Reserve, US Treasury yields and equity-market sentiment. But a weak jobs report and an interest-rate decision are separated by several important links. The Fed also watches inflation, wage growth, household spending, jobless claims and credit conditions.
It would therefore overstate the evidence to say that the Fed will certainly change policy because payrolls fell. This report may alter market expectations, but its exact contribution to a policy decision cannot be isolated from the other data. The broader lesson is to distinguish a cooling signal from evidence strong enough to establish a policy turning point.
That discipline matters especially when financial markets respond within minutes of a release. Bond yields and equity prices can move on the headline, then move again as investors examine participation, revisions and wage details. A market reaction is not proof of a single economic explanation. It is an aggregation of changing expectations, often revised as the report is read more closely.
For a Vietnamese investor following US macro data from afar, the practical value is not to predict every short-term move in US assets. It is to avoid using one familiar number as a shortcut for the entire economy. The unemployment rate remains useful, but its message is incomplete whenever the size of the labour force is changing materially.

A practical monitoring framework starts with four questions. Do nonfarm payrolls continue to weaken? Is unemployment falling because more people find jobs, or because the labour force keeps shrinking? In which direction are prior months revised? And does inflation give the Fed room to respond?
The July report supports a clear thesis: the fall in US unemployment to 4.1% should not be treated as standalone evidence of a strengthening labour market. A smaller labour force is the prominent driver, while the latest payroll reading and the revisions point to a more cautious picture. The next report, together with participation and inflation data, will clarify whether this is a temporary fluctuation or a more persistent cooling trend.