
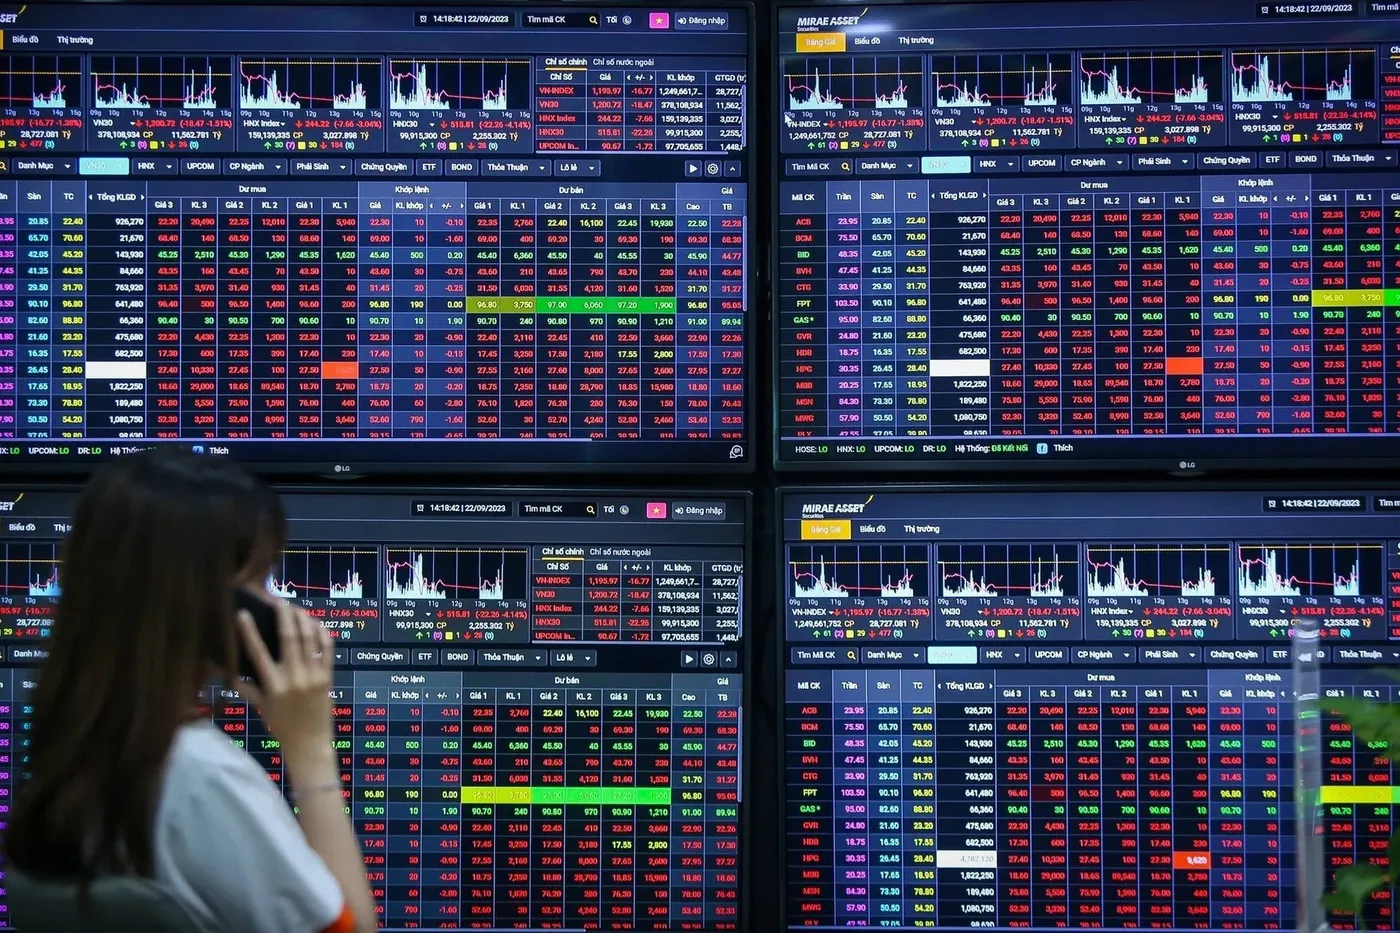

The VN-Index traded above 1,700 on the morning of 27 July, then closed at 1,669.01. That session does not prove the market must fall further; it shows that buyers did not yet hold the higher price area. Calling this a balanced market now would therefore go beyond what the data supports.
Think of the market as a set of scales. The index is the visible needle, while breadth and turnover show how much weight buyers and sellers are actually placing on each side. When the needle rises briefly and then retreats, the useful question is not whether the next morning opens green or red. It is whether demand is broad enough to absorb supply.

A round number does not create balance
On 27 July, the VN-Index reached an intraday high of 1,700.69 before closing 31.68 points below that level. It fell 17.10 points, or 1.01%, from the prior session, with volume of 635,422,543 shares. The figures show that buyers were willing to pay more early in the day, but were not strong enough to sustain those prices into the close.
That is the difference between touching a level and holding an area. An index can rise for a short time because buying is concentrated in large-cap names. A more credible balance takes repeated tests of the lower range, with prices holding and the broader equity market no longer falling in unison.
The 23 July session offers a nearby comparison. The VN-Index gained 1.85% to 1,699.38, while HOSE recorded 189 rising stocks and 122 falling stocks.VnExpress The advance had broader participation, rather than relying solely on a handful of large companies.
Breadth shows what happens beyond the index
On 27 July, HOSE had 84 gainers, 268 decliners and 19 floor-price stocks. Decliners outnumbered gainers by more than three to one. Looking only at the VN-Index's 1.01% loss could make the session appear manageable, but breadth suggests many portfolios may have felt a much sharper decline.
The reason is market-cap weighting. A small number of large companies can cushion the index even while most stocks in a portfolio weaken. Put simply, a green index is not the same as a broadly green market. Likewise, an index rebound does not automatically mean the underlying market has regained strength.
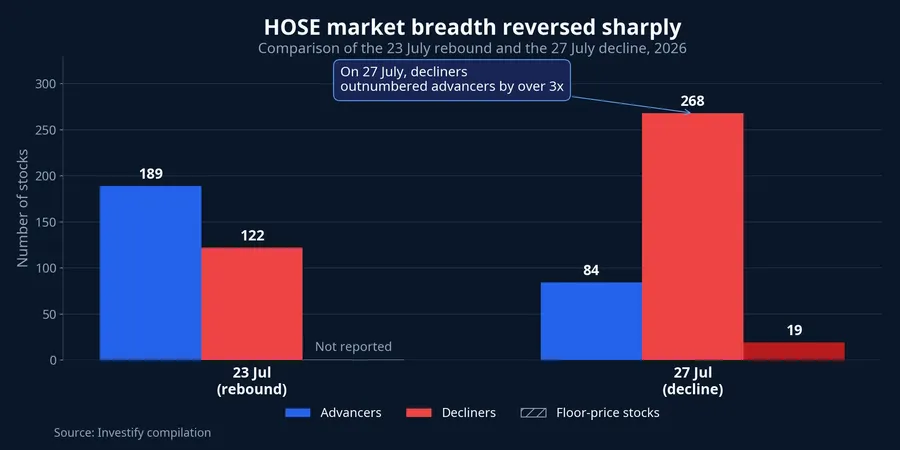
The chart makes the change across the two sessions easier to see than a headline number. On 23 July, gainers exceeded decliners; on 27 July, there were 268 decliners and 19 floor-price stocks. The source did not report the number of floor-price stocks on 23 July, so the chart labels it as unreported instead of assuming zero. That is a useful reading discipline in its own right: an unknown should not be turned into a convenient conclusion.
In the next sessions, improvement need not arrive as a powerful rally. A more useful pattern would be a steady reduction in floor-price stocks, gainers moving closer to or above decliners, and breadth holding up into the close. That would offer evidence that buying is spreading beyond a narrow group of large caps.
Support is an observation zone, not a promise
Pre-week analysis identified 1,650–1,670 as an area where buying demand could show a response, with 1,680–1,700 as the nearer test range.Tạp chí Kinh tế Tài chính A potential response is very different from a confirmed bottom. Support is where investors watch buyer and seller behavior; it is not a promise that prices will immediately rebound.
MBS also treated 1,658 as a condition to watch. If the index holds that low, a balance area could gradually form; if it breaks, the area around 1,600 becomes the next level to monitor.CafeF These are alternative scenarios, not a certain forecast that the index will follow a predetermined path.
So, if the VN-Index returns to 1,650–1,670, an initial bounce would only be the first signal. The next test is whether gains can hold when the index approaches 1,680–1,700 again. If the recovery gives back most of its gains late in the day while decliners remain dominant, the market is still searching for a stopping point.
Turnover must be read alongside price direction
Large turnover is often presented as a positive sign, but volume has no direction on its own. In the week of 20–24 July, average value traded on HOSE was VND 19,871 billion per session, up 27.28% from the prior week. The source noted that trading was concentrated in sharp down sessions, while buying during rebounds remained tentative.Tạp chí Kinh tế Tài chính
Read turnover alongside three questions: where did the price close within the day's range, did the number of gainers expand, and was money concentrated in only a few large names? Rising volume in a rebound is more convincing when the close is near the daily high and breadth improves. Heavy volume in a falling session can instead signal active supply, especially if the count of floor-price stocks rises.
Low turnover is not automatically constructive either. If prices move sideways in a narrow range and floor-price stocks recede, it can mean sellers are becoming less aggressive. But if a rebound is weak, breadth remains poor and trading is thin, the more cautious interpretation is that buyers are not yet prepared to pay higher prices.
What would confirm a balance area?
The central view is that 27 July did not confirm a bottom or a balance area. That does not mean every subsequent rebound must fail. It means the market needs more evidence before it receives that label. The evidence to watch is whether 1,650–1,670 holds through renewed selling, breadth improves, floor-price stocks diminish and closing prices stop repeatedly sliding back toward the day's lows.
For new investors, these signs can function as a checklist instead of an invitation to react to an early-session color change. One move above 1,700 is not an answer. The missing confirmation is whether buying demand can hold the broader equity market through several waves of selling.