
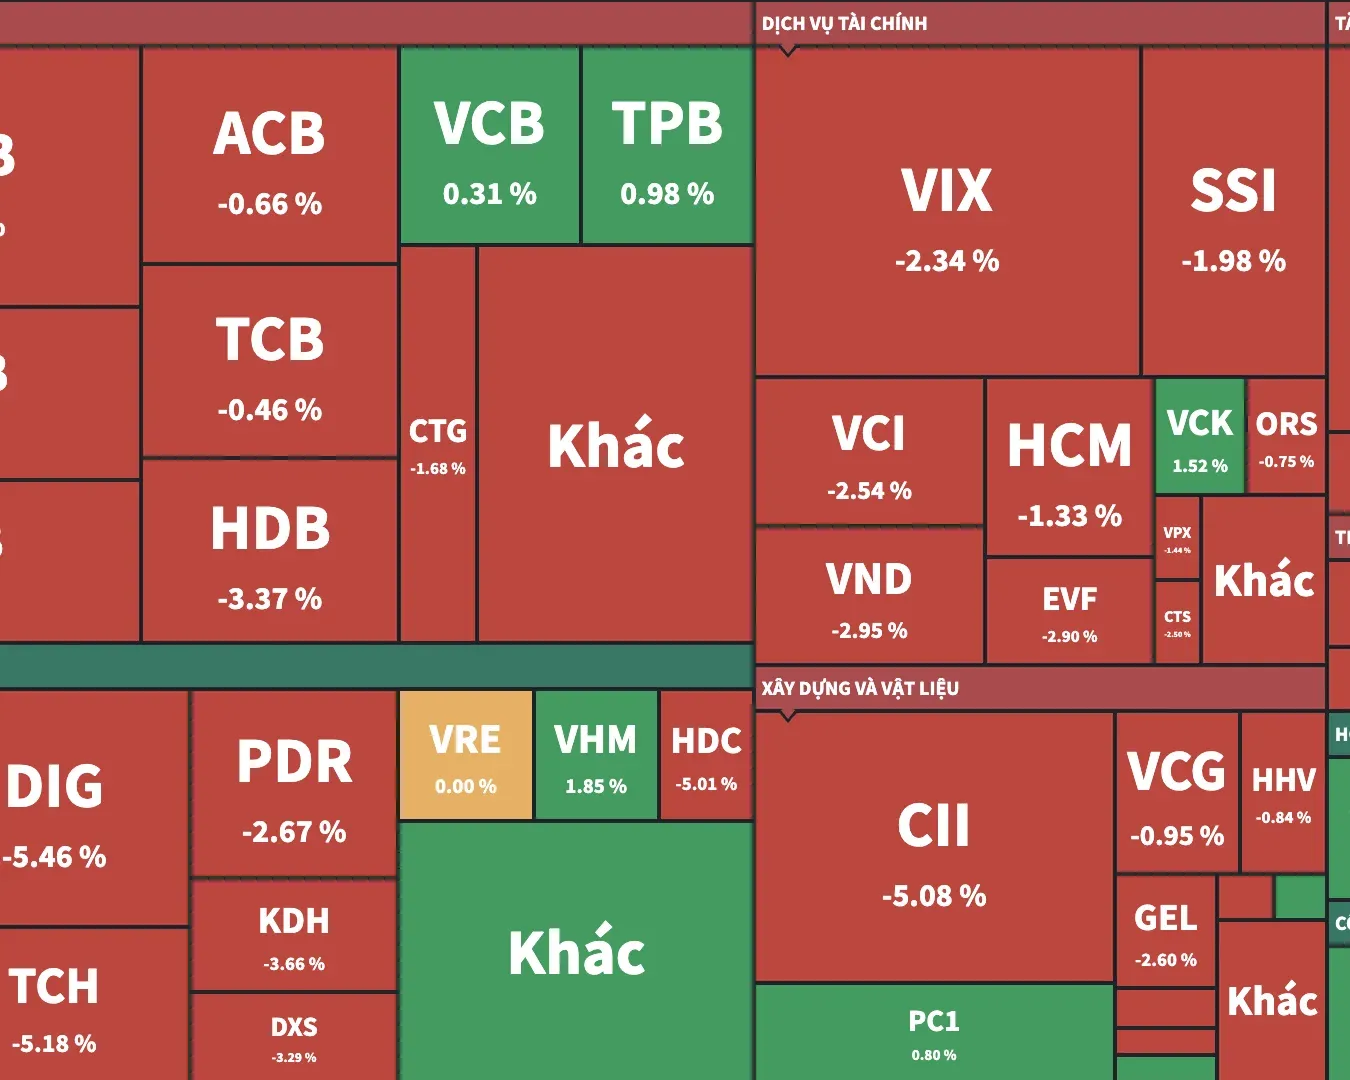

The VN-Index closed July 20 at 1,743.51 points, down 43.94 points or 2.46%. The more revealing numbers on the board, however, were 47 advancers against 312 decliners on HOSE, with 33 stocks closing limit-down. This was a decline with broad selling pressure, not simply a handful of heavyweight shares pulling the index lower.
For someone new to the market, a 40-plus-point loss can trigger two opposite reactions: panic at the deep red index, or a quick assumption that prices have fallen far enough to rebound. Both reactions miss the more useful question: how many stocks are under pressure, and is that pressure being absorbed? Market breadth helps answer it.
The central view is straightforward. The July 20 session showed selling spread across HOSE. A green VN-Index in the next session alone would therefore not establish balance; confirmation needs to appear across stocks, in the number of limit-down names, and in how prices behave when volume is high.
What market breadth measures
Market breadth is simply the count of stocks that rise and fall in a session. The VN-Index measures the changing value of a basket of shares weighted by market capitalisation. Breadth answers a more practical question: is the board broadly green, or broadly red?
The distinction matters because large-cap shares exert more influence on the index. If only a few index heavyweights decline while most stocks hold up, the VN-Index can still lose substantial points. In that setting, the index drop does not fully describe the experience of an investor with a diversified portfolio.
The reverse is also true. When most shares fall, market risk is no longer concentrated in one group. That is why the point move in the VN-Index should sit beside the advance-decline data. The measures do different jobs: one captures direction and scale in the index, while the other shows how widely the move has spread.
July 20 showed broad selling dominance
On July 20, HOSE had more than 6.6 declining stocks for every advancing stock. Among stocks with available advancing, declining, or unchanged data, decliners accounted for about 81%. That ratio indicates pressure across most of the board rather than in only a few large constituents.
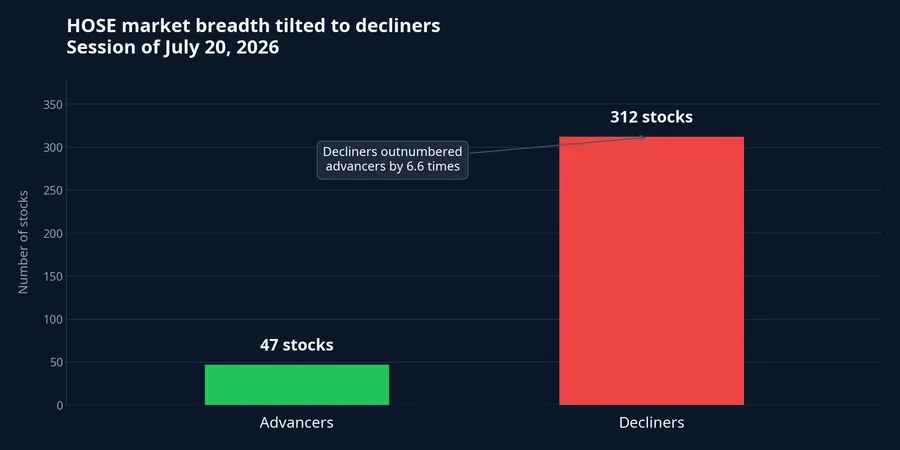
The pattern did not emerge only in the closing auction. Báo Nghệ An reported that, after a little more than an hour of trading, decliners on HOSE already outnumbered advancers by more than three to one.Báo Nghệ An By the close, the gap had widened to 47 gainers and 312 losers, indicating that the pressure persisted through much of the session.
That does not identify the cause of each sell order. Some investors may have reduced exposure, some may have managed margin positions, and others may have cut losses or rebalanced. Breadth only confirms the observable outcome: declining stocks dominated. Without flow and sector-level evidence, it should not be used to assign a single cause to the sell-off.
Thirty-three limit-down stocks add intensity
A stock down 0.5% and one that falls its full daily limit both count as one decliner. After breadth, investors should therefore examine the number of limit-down stocks. It shows how far the decline extended for the shares under the greatest pressure.
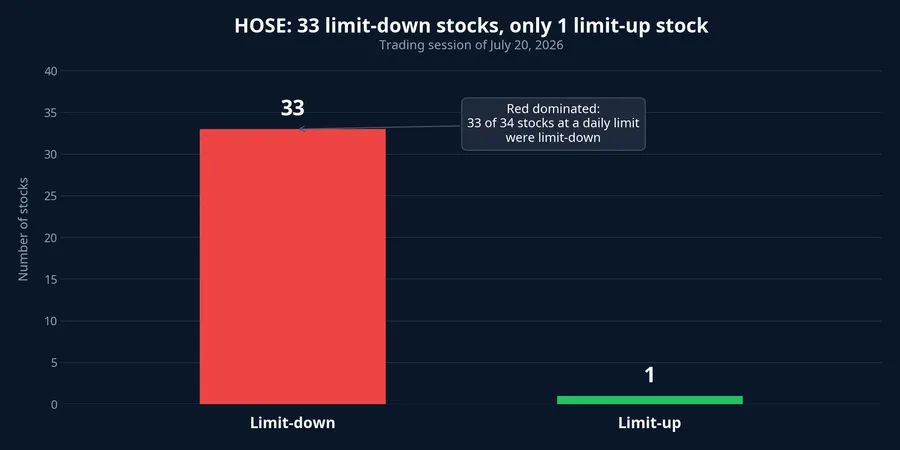
HOSE recorded 33 limit-down stocks on July 20, against just one limit-up stock. About 8.6% of stocks with available advancing, declining, or unchanged data closed at their floor. The imbalance says more than red being widespread: a meaningful set of stocks ended at the lowest price permitted for the day.
Even so, a limit-down close does not mean a share has no buyers, and it does not automatically signal that the market has found a bottom. One stock can touch its floor intraday and recover before the close. Another can retain a large sell queue at the floor through the session. Those are different situations, so the limit-down list is a starting point for observation, not a final verdict.
For current holders, the 33 names should not be read as an instruction to sell at any price. It is better understood as a description of the risk environment: the chance of many shares weakening at the same time is higher. In that environment, a brief index rebound does not establish that the wider market has stabilised.
Nearly doubled volume must be read with price
HOSE volume reached approximately 862.6 million shares on July 20, compared with about 435.9 million shares on July 17. That is an increase of roughly 97.9%, or nearly a doubling. Put simply, far more shares changed hands while the overall price level was falling.
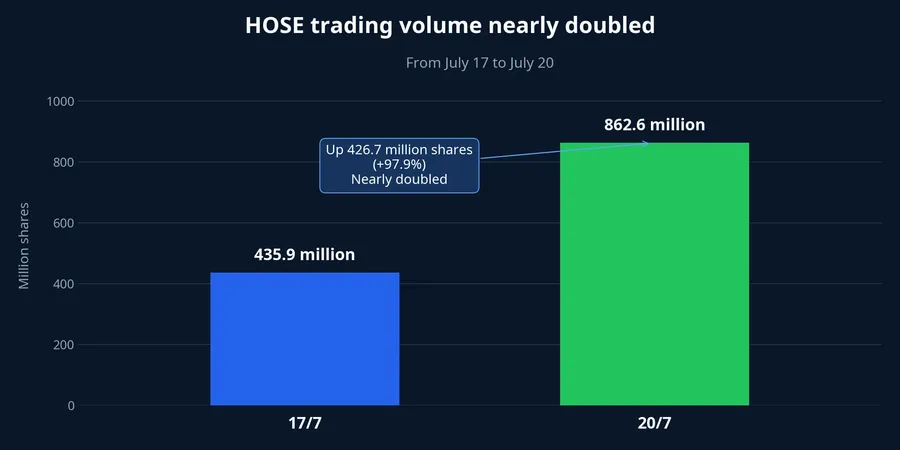
Higher volume alongside lower prices often shows that selling pressure was accompanied by real trading activity, rather than a price slide in a thin session. But heavy turnover does not prove that sellers have decisively won, because every transaction also has a buyer. It tells us only that supply and demand met with greater intensity.
Volume must therefore be assessed with the closing pattern. If turnover stays high while more stocks leave their floors, breadth narrows, and closing prices move away from intraday lows, buyers may be absorbing supply more effectively. If volume remains elevated while limit-down names grow and decliners continue to dominate, supply remains the side to watch more closely.
What the next session needs to confirm
First, watch whether the gap between advancing and declining stocks narrows meaningfully from 47 advancers and 312 decliners. The market does not need to turn broadly green at once to improve. A rebound joined by many shares is more credible than one carried by only a few large-cap names.
Second, watch the count of limit-down stocks. If more shares leave their floors, sell queues are absorbed, and the list becomes shorter than the prior session's 33 names, the intensity of selling has grounds to be judged as easing. This is evidence from the wider stock universe, not just from the index.
Third, watch the relationship between volume and price. Heavy trading alongside better breadth and closes above intraday lows would show a clearer buyer presence. By contrast, lower volume while the board remains heavily tilted toward decliners would only indicate that selling has slowed temporarily; it would not yet prove that demand has returned.
The conclusion from July 20 is not a bottom call or a call to act. The available data supports the view that selling pressure had spread broadly across HOSE. The relevant signals in the coming sessions are therefore broad confirmation: a less lopsided advance-decline balance, fewer limit-down names, and prices holding up while volume remains high. Only when these indicators improve together does a green VN-Index carry more weight as evidence of market balance.