


You open your trading app, see VN-Index up more than 1%, then check your own portfolio and find it mostly red. That feeling isn't because you "missed the move" or picked the wrong stocks. In the September 4 morning session, VN-Index closed the half-day at 1,847.54 points, up 19.82 points, or 1.08%. Yet in that very same session, HOSE recorded 177 declining stocks, clearly outnumbering the 121 that rose. Both numbers are accurate. They're just measuring different things.

VN-Index counts money, not stock tickers
Put simply, VN-Index isn't a vote where every stock gets one equal ballot. Per VnExpress's explanation, the index is calculated as the current total market capitalization of all HOSE-listed stocks, divided by the total market cap of those same stocks at the base period.VnExpress The larger a stock's market cap, the more it moves the index, regardless of how many shareholders the company has or how many dong its share price changes by.
You can see how large this market-cap gap is on HOSE through the September 4 example. VIC's market cap alone stood at nearly VND 1,957 trillion. Combine four other large names, Vietcombank at VND 490.5 trillion, Vinhomes at VND 309.7 trillion, Techcombank at VND 228.9 trillion, and Hoa Phat at VND 166.2 trillion, and the total comes to only about VND 1,195.3 trillion, still more than VND 760 trillion short of VIC alone.
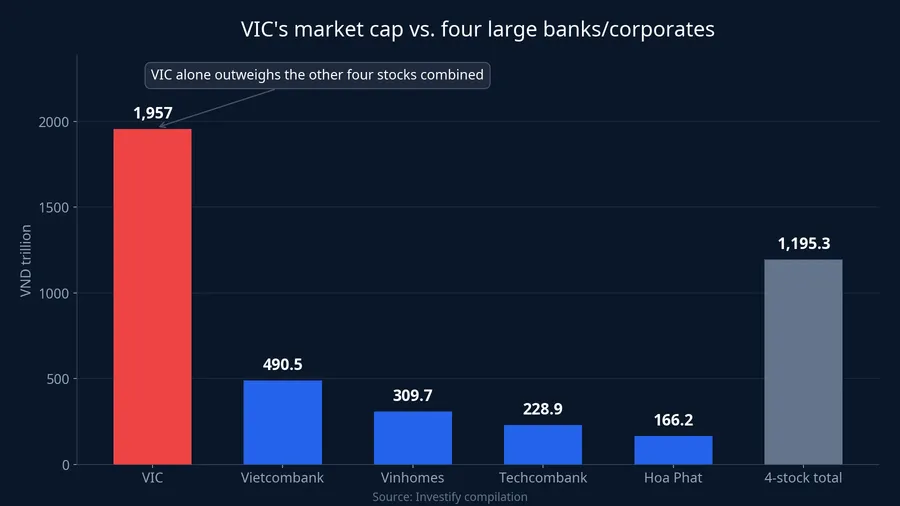
That comparison directly explains what happened this morning. VIC traded at VND 254,000 per share, up 3.89%. Three other Vingroup-affiliated stocks rose in tandem: VHM up 2.72%, VPL up 2.09%, and VRE up 1.52%. The added market cap from these four stocks alone was enough to lift the whole index, even as hundreds of small and mid-cap stocks below were losing ground.
You can picture how large Vingroup actually is through Landmark 81, once Vietnam's tallest building, built by the group in Ho Chi Minh City. VIC's market cap on the exchange looms just as large as that physical structure does in the skyline.

To see this mechanism more clearly, look at VN30, an index that caps the weight of each individual stock precisely to prevent one name from dominating the benchmark. On September 4 morning, VN30 rose only 0.85% to 1,978.27 points, lower than VN-Index's 1.08% gain, even though the VN30 basket is where large-cap names are concentrated. The tighter an index caps individual weights, the more modest its gain when a single stock surges.
Why most of the board still shows red
Over the same window, the other two exchanges told a different story. HNX-Index fell 0.04%, with 43 advancers against 66 decliners. UPCoM-Index fell 0.05%, with 81 advancers against 96 decliners. Neither exchange has a stock the size of VIC to carry the index, so both track the state of the average stock fairly closely: flat, tilted toward declines.
This matters directly for your wallet. A typical individual investor's portfolio is mostly small and mid-cap stocks, the group that barely moved this morning. The 1.08% figure only describes total market cap on HOSE. It says nothing about the odds that any given stock in your portfolio is rising.
This isn't a one-session story
This pattern of "green index, mostly red stocks" has repeated multiple times over the past two weeks. On August 25, VN-Index rose 0.15%, but only 88 stocks advanced against 222 decliners. On August 27, VN-Index rose 0.56%, with 116 advancers and 187 decliners. On August 28, VN-Index barely moved, up 0.03%, with 137 advancers and 159 decliners. And in this morning's session, VN-Index rose 1.08% with 121 advancers and 177 decliners.
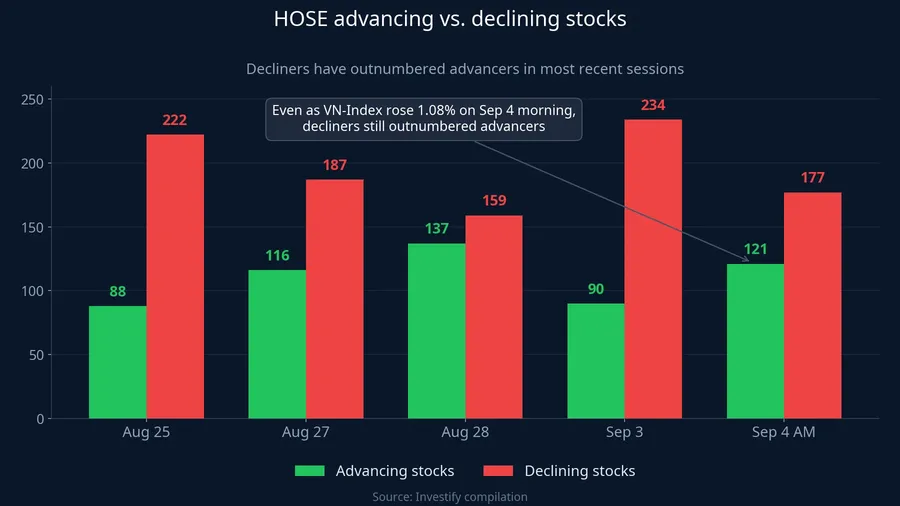
Looking at this five-session stretch, an investor who only tracks the index's color would see mostly green sessions. But an investor who also checks advancers versus decliners sees a very different picture: decliners outnumbered advancers in most of those sessions, including ones where the index itself closed green.
Vietnam's market has a clear precedent for how far a single large stock's dominance can go. In the April 22, 2026 session reported by Dân Việt, VIC hit its daily price limit, up 6.97%, and that single stock contributed more than 23 points to VN-Index, while the whole index gained just 23.82 points that day.Dân Việt In other words, the combined gain from nearly 400 other HOSE-listed stocks that day added up to less than one point.
Don't swing to the opposite extreme
To be clear, this morning's rally wasn't driven by one stock alone. Banking stocks recovering from a heavy sell-off on September 3 also contributed meaningfully. Techcombank rose 0.62% after falling 3.89% the previous session, and within the VN30 basket, 17 stocks rose against 7 that fell. Market-wide breadth also improved from September 3, when HOSE had only 90 advancers against 234 decliners.
So this morning's gain has several plausible explanations that coexist: the sheer market-cap weight of the Vingroup family, renewed buying in bank stocks after a correction, and broadly easing selling pressure. The data leans most toward the first explanation, because the two indices without any mega-cap stock, HNX-Index and UPCoM-Index, both sat below their reference levels, while VN30, which caps individual weights, rose less than VN-Index. If buying had genuinely spread across the market, those other three indices should have turned green too.
It's also worth noting all these figures cover the morning session only, not the closing numbers. The afternoon session still had trading hours left, and the picture could shift.
How to read a session correctly
For newer investors, the habit of reading the market can expand by a few layers without costing any extra time each day.
First, look at the advancer and decliner counts right next to the index number. This is free data, already displayed on most brokerage price boards. An index gain accompanied by a strong lead in advancers is a fundamentally different session from an index gain accompanied by a lead in decliners, even though both show green.
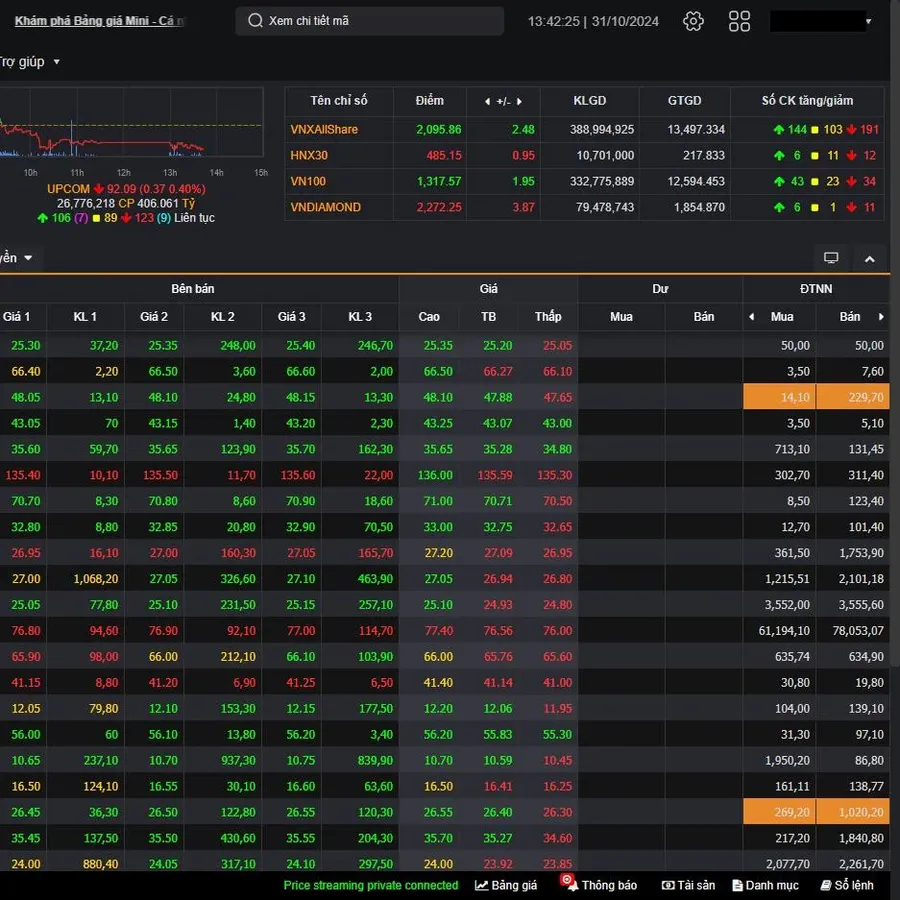
Second, compare VN-Index against HNX-Index and UPCoM-Index. When all three indices turn green together, money is flowing broadly across the market. When only VN-Index is green while the other two are red, it's more likely that a handful of large-cap stocks are carrying the index alone.
You should also compare VN-Index's gain against VN30's. Because VN30 caps each stock's weight, when VN-Index rises noticeably more than VN30, that's a signal that a stock outside the weight limit is dominating the point count.
Finally, check against your own portfolio. If the index is green while your account stays red for several sessions in a row, the issue usually isn't that you "missed the move." It's more likely that the stocks you're holding aren't the ones large money is currently buying.
What to watch next
None of this is a formula telling you to buy or sell. But when the index and market breadth diverge for several sessions in a row, the way to be careful is to lower your expectations for how broadly a rally is spreading, rather than assuming the whole market is rising just because one percentage figure is green.
The specific signal worth watching in this afternoon's session (September 4) is straightforward: will advancers on HOSE overtake decliners? If the index holds its gain while breadth still tilts toward decliners, today remains a session carried by a handful of large stocks, not yet a broad market recovery.