

VN-Index closed August 13 at 1,765.63 points, down 27.55 points or 1.54%. That is an important move, but it is not the whole story. New investors often react to a down day in one of two ways: they either assume panic has arrived, or decide prices must now be cheap enough to buy. Neither conclusion is sound without looking at market breadth and turnover.
The session data makes one point reasonably clear: selling extended beyond a handful of large stocks. But closing data alone does not justify calling the day a sell-off. The working conclusion is narrower: the market is warning of broadening selling pressure, while the next session must show whether that supply is actually being absorbed.
An index is the starting point, not the answer
Think of VN-Index as a room thermometer. It captures the overall change in temperature, but not which corner is warmer or colder. A small group of heavily weighted shares can move the index materially. A 1.54% decline therefore does not answer the more useful question: did most stocks weaken, or did a narrow group pull the aggregate lower?
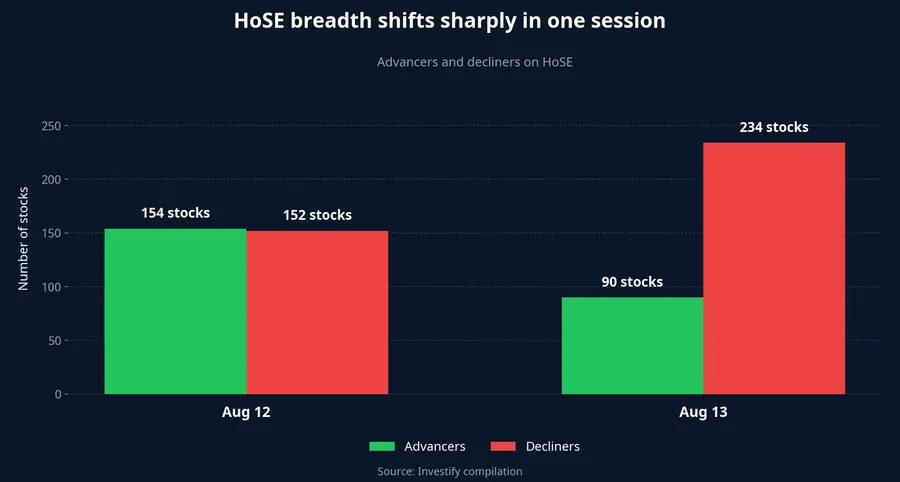
Market breadth fills in that missing context. HoSE recorded 90 advancing stocks and 234 declining stocks on August 13, or roughly 2.6 decliners for every advancer. The previous session had been close to even, with 154 gainers and 152 decliners. That one-day shift suggests the red screen was no longer a localised event.
This distinction is especially useful for first-time investors. A falling portfolio is not automatically evidence that an investment case is broken; a broad market mood may be affecting it. Equally, a share holding its ground while the index falls is not automatically a better business. Breadth describes the day’s supply-and-demand backdrop. A company still needs to be assessed through earnings, cash generation and valuation.
Weakness appeared across market-cap groups
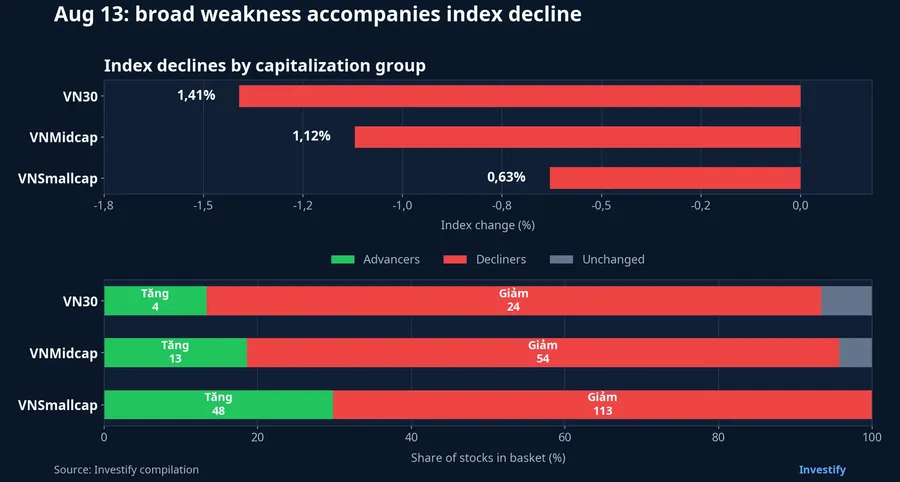
The index baskets confirm that the weakness was not confined to market leaders. VN30 had 4 advancers and 24 decliners while its index fell 1.41%. The mid-cap basket had 13 gainers and 54 decliners, with the index down 1.12%. Small caps had 48 gainers against 113 decliners, while their index declined 0.63%.
Those percentage changes should not be added together because each basket has its own constituents and weights. The comparison serves a different purpose: large, mid-sized and small companies all tilted lower. VN30 was weaker in index terms, but the data does not support an explanation based solely on a few large shares dragging the market down.
That shared weakness also changes how to read any rebound. If VN-Index recovers because a few heavyweight names turn higher while mid-caps and small caps remain red, that is an index recovery rather than a broad market balance. A more reliable stabilisation would require participation to improve across several baskets at the same time.
What higher turnover says, and what it does not
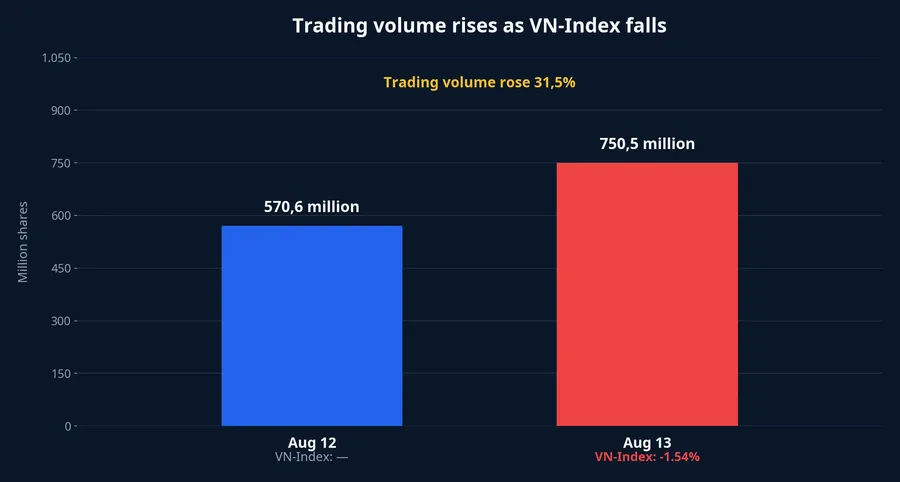
VN-Index trading volume reached 750.5 million shares, about 31.5% above the previous session’s 570.6 million shares. When more shares change hands while most prices fall, the decline carries more weight than a thinly traded drop. Sellers were willing to transact at lower prices in many stocks, while demand was not strong enough to preserve the earlier price level across the market.
High volume does not mean every order was a sell order. Each completed trade has a buyer on the other side. The more accurate reading is that buyers remained present, but sellers applied enough pressure for transaction prices to fall in many names. That is why turnover needs to be read together with breadth, rather than treated as a standalone verdict on sentiment.
The rise in activity was uneven. VN30 volume rose from 227.9 million to 313 million shares. Mid-cap volume increased from 260.3 million to 352.5 million shares. Small-cap volume, by contrast, moved only from 71.7 million to 73.6 million shares. Trading intensified more visibly in large and mid-sized shares, but the data cannot determine whether this reflected portfolio rebalancing, profit-taking or pressure from margin borrowing.
Broad sector losses do not make every business weaker
Several sector indices also fell: real estate declined 2.95%, information technology 1.90%, industrials 1.28% and financials 1.14%. These figures support the view that the red screen was widespread. They do not prove that the earnings outlook for every company in those sectors deteriorated in a single session.
There were exceptions. Consumer goods rose 0.46%. Methodologically, that exception matters: broad selling does not mean every stock declines, and one trading day is not a quality assessment of every business. Daily prices reflect short-term supply and demand. Long-term value requires evidence on profits, balance sheets and cash generation.
It is also premature to assign one cause to the decline. Closing data does not allow the move to be attributed entirely to foreign investors, proprietary desks, a particular sector or margin calls. Those are plausible explanations that need more detailed transaction data. What the evidence directly supports is the combination of falling prices, a dominant number of decliners and higher volume.
Why this is not yet a sell-off
A sell-off implies disorder: holders prioritise exit at almost any price and supply becomes extreme. Establishing that condition would require intraday action, sell queues at floor prices, the share of aggressive sell orders, forced-liquidation evidence and the market’s rebound from its intraday low. None of that is available in closing data.
August 13 recorded only 2 floor-price decliners and 5 ceiling-price gainers. That does not deny that selling pressure strengthened, but it also does not show a market-wide cascade into floor prices. Precise language helps investors stay calm: this was a significant decline with weak breadth and higher turnover, not proof of panic.
What to watch next
First, watch breadth. The number of decliners needs to narrow, advancing stocks need to recover, and the improvement should be visible in VN30, mid-caps and small caps. If the index turns green on a few heavyweight shares while the rest of the market remains red, balance has not returned.
Second, watch the relationship between price and turnover. High turnover alongside a stabilising index and improving breadth could indicate that demand is absorbing the shares offered for sale. High volume combined with further price declines and a dominant number of decliners would confirm that sellers remain in control. A sharp fall in turnover with flat prices also warrants care, because both buyers and sellers may simply be waiting.
Finally, look for agreement across groups. Real estate, financials, industrials and information technology weakened together, so stability in only one sector would not be persuasive. The picture improves when red recedes across sectors and market-cap groups while turnover stops pushing prices lower.
The August 13 conclusion is therefore a wait-for-confirmation stance, not a call to action. Selling pressure broadened from the prior session and deserves respect. This view changes only if breadth improves, prices stabilise and turnover shows that supply is being absorbed; those are the signals to monitor in the next session.