


New-energy vehicles reached a notable 65.1% share of China’s passenger-car retail market. That figure describes the market’s composition, but it does not automatically answer the more important question: are consumers buying more cars? In July, NEV retail sales still fell 3.9% year on year, while the overall market fell faster, by 20.9%.CnEVPost
Put simply, market share is a slice of a pie. That slice can grow while the pie shrinks, provided the other slices contract more quickly. That is what happened here: NEVs did not need rising absolute sales to post a higher share. The central conclusion is straightforward. NEVs have won the structural shift, but investors should not treat one industry ratio as a verdict on demand or profitability at individual manufacturers.
Market share is a ratio, not unit sales
In July, NEVs accounted for 65.1% of China’s passenger-car retail sales, the highest reading in the CPCA series compiled by CnEVPost. Yet NEV retail volume was 951,000 units, below the 987,000 units sold a year earlier. Over the same comparison, the total market fell from 1.826 million to 1.461 million vehicles.CnEVPost
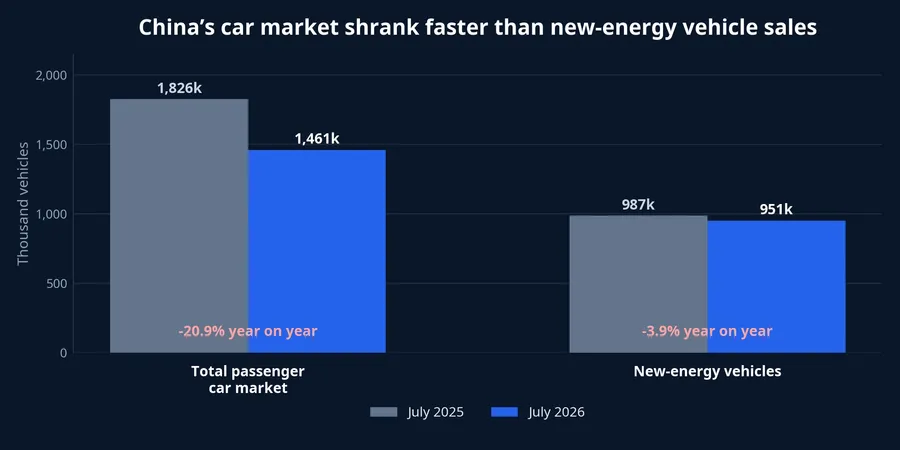
The chart separates two ideas that are often bundled together. First, NEVs are becoming the central choice for Chinese car buyers. Second, the passenger-car market as a whole did not show broad-based demand growth in the reported month. Looking only at 65.1% misses that the number of NEVs sold was also lower than a year ago.
That does not diminish the milestone. When a product group holds up better than the rest of a contracting market, it is still changing the competitive balance. But changing the balance and expanding total demand are different developments. For equities, confusing them can mean applying an industry narrative to companies with very different positions, pricing and cost structures.
This distinction also guards against a common shortcut in market commentary. A record penetration rate can be an excellent indicator of technological substitution, while being a poor real-time indicator of household spending. Both can be true at once. The investor’s task is to identify which question a statistic actually answers before using it to judge a company.
The retreat of gasoline cars drives the higher share
The denominator contracted mainly because internal-combustion vehicles lost buyers faster. Retail sales of those vehicles fell 41% year on year; pure gasoline cars dropped 44%, while conventional hybrids fell 4%.CnEVPost The more precise reading is therefore not that every NEV category is growing strongly, but that gasoline vehicles are retreating faster from the purchasing mix.

Results inside the NEV category were not uniform either. Battery-electric vehicles reached 647,000 units, up 6.0% year on year. Plug-in hybrids recorded 219,000 units, down 21.1%, while extended-range electric vehicles sold 85,000 units, down 16.5%.CnEVPost A single label may be useful for statistics, but it is too broad to infer a product outlook.
This matters especially for newer investors. Consider two manufacturers classified as NEV makers: one concentrated in battery-electric cars and the other more dependent on plug-in hybrids. A headline about a 65.1% share does not say they face the same demand conditions. Before drawing a conclusion, investors need to know which powertrain drives each company’s volume and how that segment is moving.
Retail, wholesale and exports tell different stories
July’s data can also mislead because the industry is measured in several ways. While domestic NEV retail sales declined, NEV exports reached 540,000 units, up 147.8% year on year. At wholesale level, manufacturers delivered 1.446 million NEVs, up 21.3%.CnEVPost

These figures do not conflict. Retail is closer to transactions with end buyers. Wholesale measures cars leaving factories or entering dealer channels, while exports capture a different geography. A manufacturer can sustain deliveries through overseas orders or channel shipments even when domestic retail demand is slowing.
For that reason, wholesale growth alone does not establish rising profits. It needs to be read alongside inventories, discounting and operating cash flow. If cars sell through steep promotions, near-term volume can look stronger while profit per car narrows. Export growth can instead be supportive if a company manages logistics, warranties and service networks in new markets. The available data do not establish how much each factor contributes at each manufacturer.
The timing of the data matters as well. Retail sales describe what happened at the customer end in July, while wholesale and export figures may reflect production and shipment decisions made earlier. A gap between them is not automatically a warning sign, but it is a reason to check subsequent inventory and cash-flow disclosures rather than assume the three measures carry the same message.
A winning market is not a shared profit pool
In July retail data, BYD led with 223,461 NEVs, followed by Geely Auto with 105,526 and Leapmotor with 83,698. Chinese EV start-ups accounted for 26.8% of retail volume, 5.4 percentage points more than a year earlier.CnEVPost The data show that competition is moving between manufacturers as well as between electric and gasoline vehicles.
Company-level share is the question that sits closer to shareholder outcomes. One manufacturer may gain buyers by cutting prices. Another may sell fewer vehicles yet preserve average selling prices through a stronger model mix. Without average selling-price and gross-margin data, a gain in share should not be assumed to mean more value creation.
Cost pressure adds another source of dispersion. Investify’s internal database shows lithium rising from CNY 118,500 per tonne on December 31, 2025 to CNY 148,000 per tonne on August 12, 2026, an increase of approximately 24.9%. A manufacturer with in-house battery capacity, long-term supply contracts or pricing power will face a different equation from one buying cells at spot-linked prices. The same sales increase can therefore produce very different profit outcomes.
A practical reading framework for new investors
Instead of starting with sector share, start with a company’s retail sales and its year-on-year comparison. Then look at average selling prices and model mix to understand whether revenue comes from more units or higher-value models. The next step is gross margin, the revenue remaining after production costs to fund research, selling and network expansion.
Finally, examine inventories and operating cash flow. Recorded sales can rise before cash reaches the business, while quickly rising inventory can indicate that dealer channels are absorbing cars more slowly. Market share belongs at the end of this checklist as a competitive outcome, rather than at the beginning as a complete proof point.
This framework does not require a forecast to be useful. It simply prevents a single headline statistic from carrying more analytical weight than it can bear. It also makes comparisons between companies more disciplined: a volume leader, a margin leader and a cash-flow leader may not be the same business during a price-competitive cycle.
The 65.1% reading confirms a major technology shift: NEVs now dominate the composition of China’s passenger-car market. But July’s data do not prove that overall car demand is healthy, nor that profits are shared evenly. The thesis to retain is that the transition is clear; the companies turning it into shareholder value will be those that protect pricing, margins and cash flow. Upcoming earnings reports should show which ones are doing so.