


VND 6,015 billion is a number large enough to make any fund investor uneasy. Yet it is not a booked loss line for one fund, nor is it a scorecard for every person who owns a fund certificate. It is an estimate of investment performance across nine funds after separating investor money flowing in and out from changes in the funds’ asset base.
The practical distinction is simple: “loss” can refer to the size of the whole fund, the value of one fund unit, or the return earned by one holder. Those are different layers of information. Treating them as interchangeable is how a dramatic headline becomes a bad investment conclusion.
The calculation behind VND 6,015 billion
CafeF’s August 10 compilation puts assets under management at nine funds run by Dragon Capital, SSIAM and VinaCapital at about VND 47,721 billion at the end of 2025 and VND 41,107 billion on July 31, 2026. That is a decline of more than VND 6,600 billion in the combined asset base.CafeF
But a fund’s total assets do not move only because the securities in its portfolio rise or fall. When investors subscribe for more fund units, new cash increases the asset base. When they redeem units, cash leaves the fund and total assets decline even if market prices have not changed at all.
CafeF estimates net outflows from the group at roughly VND 600 billion. After taking that amount out of the overall decline, the remaining approximately VND 6,015 billion is treated as investment performance. That is a useful group-level decomposition, but it is still an aggregate estimate rather than an identically defined accounting line across every fund report.CafeF
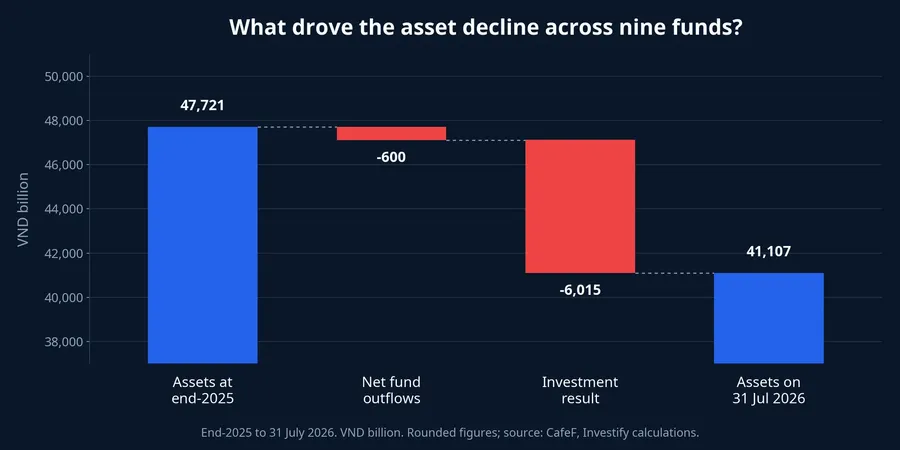
Think of a fund as a shared pool. A smaller pool can reflect falling values inside it, but it can also reflect investors taking cash out. Once redemptions are separated, investment performance accounts for the larger share of the group’s asset decline in the period covered. That still does not tell us which holdings were sold, which remain in the portfolio, or what result any individual investor has earned.
Mark-to-market losses are not fictional losses
NAV is a fund’s net asset value. NAV per unit is calculated by dividing total net assets by the number of units outstanding.Dragon Capital Net assets already take the fund’s liabilities and expenses into account. That is why NAV per unit is much closer to the experience of a unit holder than total NAV.
Fund rules require NAV to be determined from market prices, or fair value where no market price is available, with confirmation from the supervisory bank.Government of Vietnam If a portfolio stock falls on a valuation date, NAV must reflect that lower value even if the fund has not sold the stock. This is commonly described as an unrealised loss.
Unrealised does not mean imaginary. An investor redeeming while NAV is lower receives a payment based on the reduced portfolio value. It also does not mean that the fund has sold every asset and permanently locked in the full decline. A holding can recover while it remains in the portfolio; a loss becomes realised when it is sold below cost.
The VND 6,015 billion estimate does not reveal the split between those two components at each fund. That requires the individual fund’s activity report and financial statements. A group headline cannot substitute for those underlying documents.
Three questions need three measures
Total NAV answers: how much money is the fund managing? It is useful for following scale, subscriptions and redemptions. It is not an investor’s purchase price, and it is not the return on one fund unit.
NAV per unit answers another question: what is one unit of capital in the fund worth today? Comparing NAV per unit at the start and end of the relevant period shows the fund’s performance before transaction costs specific to the investor. For an open-end fund holder who wants to know whether their investment has moved with the fund, it is the first number to check.
Personal profit or loss is the third question. It depends on the NAV or market price on the investor’s own trade dates, any cash distributions, applicable fees and holding period. Two people can hold the same fund and experience very different outcomes because they entered at different times.
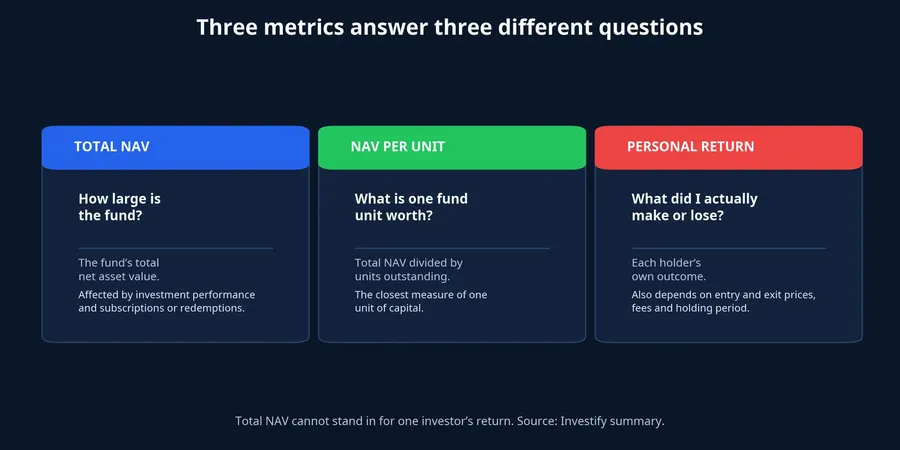
For example, NAV may be down year to date while an investor who bought years earlier remains profitable. Someone who invested immediately before a decline may have lost more than the year-to-date move. Regular investors will have their own average entry cost. Moving from a fund’s total assets to one person’s return is therefore an unsupported leap.
ETFs add one more distinction. NAV per unit reflects the underlying net assets, while an ETF’s exchange-traded price moves with intraday supply and demand and can differ from NAV. A buyer’s actual ETF return must use their market entry and exit prices, distributions and trading costs. Total fund assets cannot do that job.
The same PNJ share can lead to different fund actions
The compilation says actively managed funds sold more than 13.4 million PNJ shares in July, while the DCVFMVN Diamond ETF bought about 2.46 million shares to track its index composition.CafeF The point is not to declare either side right or wrong. It is to read the strategy before assigning a meaning to the trade.
An active fund can change a weight after reassessing valuation, risk or alternative opportunities. A passive fund is designed to replicate an index, so its purchases and sales can mainly follow index changes and the need to minimise tracking differences. Opposite trades in the same stock do not, by themselves, establish which investment view will win.

It would be premature to assign a precise motive without a fund’s own report or disclosure. The trades may coincide with price action, index changes or portfolio rebalancing. The available evidence supports saying that the funds acted differently, not calculating the contribution of each possible reason.
How to read a fund after a big headline
Start with NAV per unit over the exact period that matters to you. Then compare that move with the fund’s stated benchmark over the same period. An actively managed equity fund should be assessed against its own benchmark; a bond fund should not be placed next to the VN-Index merely because the index is familiar.
Next, consult the currently published fee schedule and dealing terms before estimating your own outcome. Management costs are reflected at fund level, while subscription or redemption fees may affect the cash an investor receives directly. The relevant schedule is the one in force at the trade date, not an old fee assumption.
Finally, examine performance across several market conditions. A few weak months can be a reason to investigate, but not enough to rank a manager’s long-term ability. Multiple periods help distinguish a recurring shortfall from a spell in which the fund’s investment style simply did not suit the market.
The conclusion is not that VND 6,015 billion should be ignored. It indicates that investment performance made up most of the combined asset decline in the period compiled. But the measures that answer whether a fund is serving your objective, and whether your own account is making or losing money, are NAV per unit, the comparable benchmark, actual costs and holding period. The next reports from each fund are where those signals can be tested properly.