


On the morning of August 4, VNE traded at VND 2,300, its 15% daily ceiling on UPCoM, with 1,065,700 shares matched. That 15% figure naturally stands out on a price board. Yet the useful starting point is not to compare it mechanically with a 7% ceiling on HOSE. It is to ask which reference price produced the move, and which market rule set the limit.
This session is a practical lesson in the difference between price movement and stock strength. A limit-up session confirms that a price has reached the furthest point allowed for that day in that market. It does not, by itself, establish the depth of buying interest, the presence of fresh corporate information, or the durability of the new price.
A 15% ceiling is UPCoM's rule, not a universal measure
HOSE's regular daily price band for equities is ±7%.HOSE HNX applies a ±10% band to listed shares, while UPCoM applies a ±15% band to its reference price. The same phrase, “limit up,” therefore operates inside three different frameworks.
A HOSE stock at its ceiling has used all of that market's permitted 7% gain for the session. VNE at its UPCoM ceiling has used UPCoM's permitted 15%. There is no simple conversion that proves VNE buyers were more than twice as determined, or that its business outlook was automatically better than that of a HOSE limit-up stock. The percentages come from different trading rules.
Think of the band as a speed limit specific to a road. Reaching the limit on an 80 km/h road does not automatically make a vehicle “stronger” than one reaching 50 km/h on another road. To judge the journey, an observer still needs distance travelled, traffic conditions, and the reason for the acceleration.
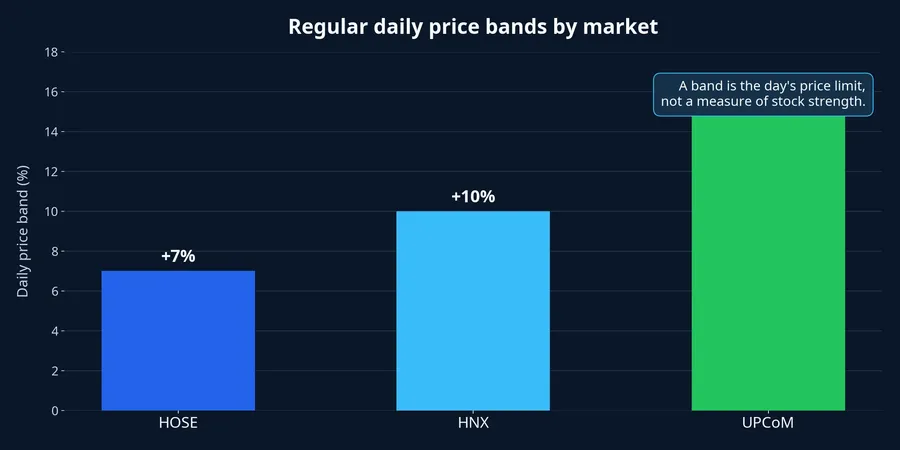
For a stock, the equivalents are liquidity, value traded, shares outstanding, the path before the rise, and verified company disclosures. The percentage change is only a starting point. Treating it as a complete verdict confuses a trading constraint with a signal that has been confirmed by the market.
UPCoM's reference price may differ from the prior close
The key detail in VNE's session is not merely the 15% band but the benchmark used to calculate it. In a normal UPCoM session, the reference price is the volume-weighted average of prices executed in the prior session. The closing price, by contrast, is the price of the final transaction. Those figures can differ. For VNE, the August 3 close was VND 2,100, while the August 4 reference price was VND 2,000. When trades reached VND 2,300, the board recorded a VND 300 gain, or 15% from the reference price. Relative to the prior closing trade at VND 2,100, however, the gap to VND 2,300 was approximately 9.52%.
There is no inconsistency between the two calculations. One describes the trading status for the day; the other describes how far the current price sits from the previous session's final trade. Using the wrong benchmark distorts both an expected UPCoM ceiling and the move an investor is actually trying to compare.
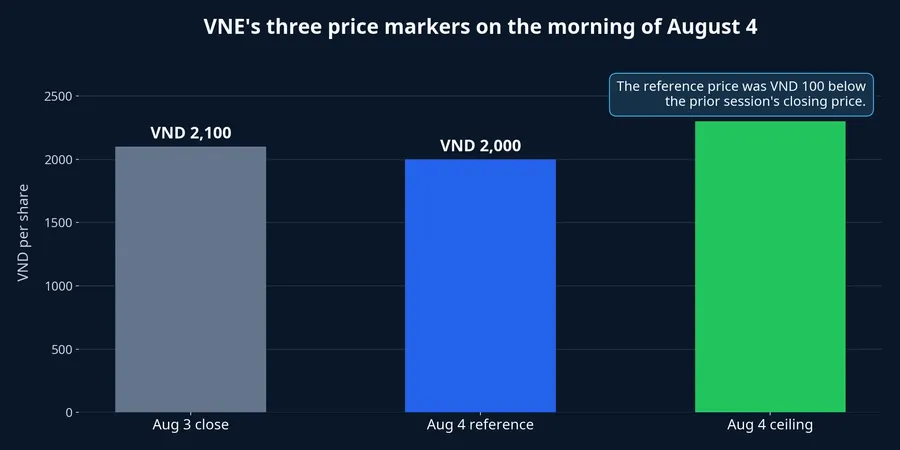
That is why an investor should not simply add 15% to yesterday's close to calculate a UPCoM ceiling. The first step is to read the reference-price column on the trading board. When it is below the close, the displayed percentage gain can look larger than the change from the prior final trade. The reverse can happen as well.
What higher turnover tells us, and what it does not
VNE matched 1,065,700 shares during the morning of August 4, above the 471,300 shares matched in the entire August 3 session. That observation rules out a reading in which the ceiling was created by only a handful of small orders. More shares changed hands than in the immediately preceding session.
But higher turnover is not an explanation of cause. It does not identify the buyers, the information they acted on, or whether demand will persist once the price band reopens the next day. One million shares at a few thousand dong represent a very different amount of capital from one million shares at a much higher market price.
VNE's HNX disclosure record did not show fresh information during the day that could be directly tied to the move. The disciplined reading is therefore to record two observable facts: the price reached its UPCoM ceiling and trading activity rose. The force behind the move remains unproven in public information.

Several explanations may coexist: thin supply at that price, short-term trading flows, a reaction after an earlier decline, or expectations not yet reflected in an official disclosure. None should be presented as the primary driver while the available evidence cannot separate their contributions. This is the line between observing a price board and inferring a change in a company's underlying value.
A reading routine for newer investors
First, identify whether a ticker trades on HOSE, HNX, or UPCoM. This determines the applicable band. It also prevents investors from treating a limit-up session as a standardized unit for ranking stocks across different markets.
Next, distinguish the reference price from the prior close. In regular HOSE and HNX trading, the reference price is usually the most recent close. On UPCoM it is volume-weighted, so it must be read directly rather than assumed to equal the prior close.
Only then should turnover and trading value enter the picture. Volume above a recent baseline shows that the new price came with transactions, but it needs to be viewed against shares outstanding and the share price to assess the actual scale of capital involved. Comparing several recent sessions is generally more informative than relying on just the day before.
Finally, check company disclosures and official exchange notices. Financial results, contracts, leadership changes, or board resolutions can provide evidence against which a price reaction can be tested. Without them, a sharp move is better described as an intraday supply-demand signal, not proof that intrinsic value has changed.
Conclusion: read the benchmark before the signal
The conclusion from VNE's session is straightforward: its 15% UPCoM limit-up move cannot on its own be used to rank it against a 7% HOSE limit-up move. Different price bands create different headline percentages, and UPCoM's reference price can itself diverge from the previous closing price.
On the morning of August 4, VNE reached VND 2,300 from a VND 2,000 reference price and recorded more turnover than on August 3. Those are real and relevant observations. They are not enough to confirm a lasting revaluation, because no new public disclosure directly explains the move.
The next useful signals are not merely another purple price cell. They are the new reference price, activity once the band reopens, and any verifiable company disclosure. Reading those three inputs together can keep new investors from turning an eye-catching percentage into a premature conclusion.