


VN-Index ended 31 July at 1,735.78 points, down 0.51%. The more revealing detail sits beneath that modest decline: 119 stocks advanced while 196 fell. When the index barely moves but many portfolios are noticeably weaker, that is not necessarily a personal investing failure. It is a reminder that an index and the health of the average stock do not always move in step.
Think of VN-Index as a class average, while market breadth shows how many students actually did well. A handful of large-cap shares can lift the index without showing that money has reached most of the market. The central point for the coming week is therefore not a forecast for a particular level. It is whether three signals can answer the same question: is the rebound being confirmed by a broad set of stocks and by committed trading activity?
The index has recovered, but most shares have not caught up
From 1,668.53 points on 22 July, VN-Index rose to 1,744.66 points on 30 July, a recovery of about 4.56%, before easing to 1,735.78 points on 31 July. That is a visible rebound, but it does not by itself establish a new uptrend. A trend becomes more durable when buying spreads beyond a few heavyweight names into a wider range of sectors and shares.
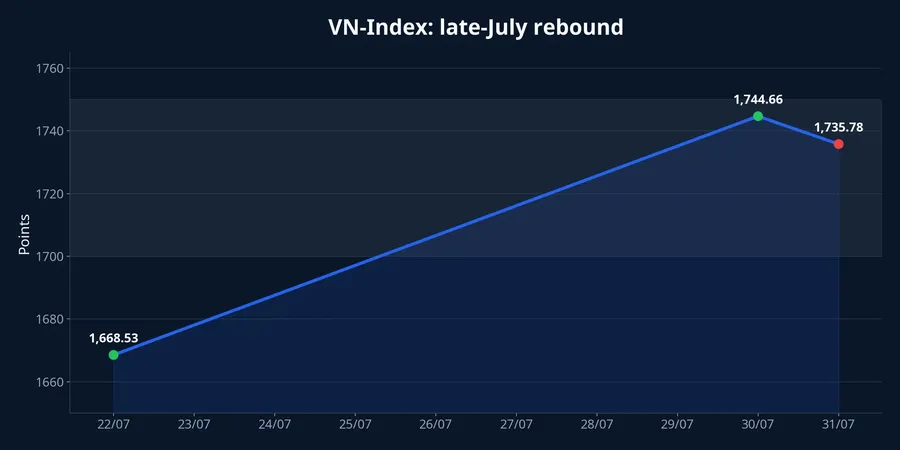
On 28 July, VN-Index gained 11.61 points to 1,680.62.VTV One rising session does not settle the story. Prices may respond to bargain hunting, a rebound in large-cap shares, or a temporary pause in selling. Those forces can coexist, and the available evidence does not allocate their individual contribution. The more accurate reading is that the late-July move remains a recovery awaiting confirmation.
The 31 July session shows why that confirmation is unfinished. With 196 decliners against 119 advancers, the experience of many shareholders could be materially worse than the index's 0.51% decline. For a new investor, this avoids a common reflex: seeing VN-Index near a high and adding to a weak share simply because the market appears fine. Every holding still needs to be assessed through its own price action and liquidity.
Breadth shows whether a rise is spreading
Market breadth is a straightforward count of advancing and declining stocks. It does not replace company analysis, but it is especially useful when markets are moving quickly. When VN-Index rises and advancers dominate, buying is reaching further across the market. When the index rises while decliners remain numerous, the gain may be concentrated in a small number of large companies.
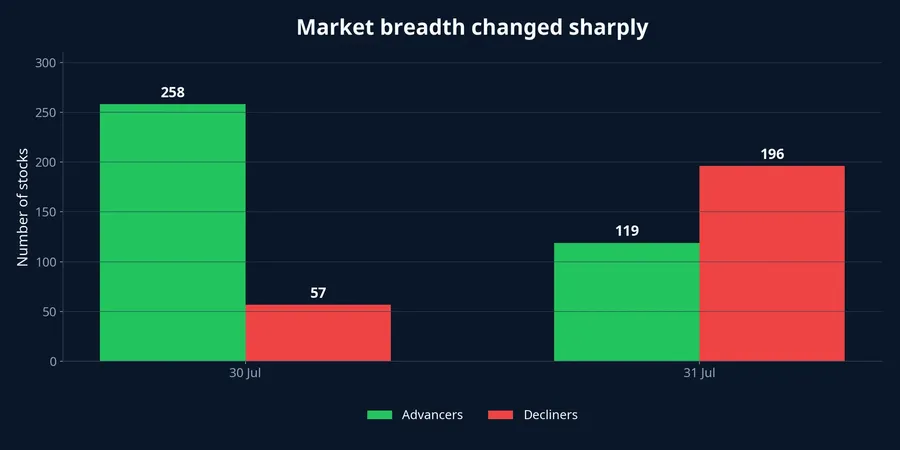
The contrast across the final two July sessions makes the point. On 30 July, the market recorded 258 advancers and 57 decliners. On 31 July, the balance shifted to 119 advancers and 196 decliners. One session is not a rule, but the two different states show how sensitive breadth remains. A single green day should not be treated as proof that risk has disappeared.
A more reliable positive signal would be a move above the area around 1,750 points, with advancers retaining the upper hand for several sessions. There is no universal “enough” number because the composition of the market changes by sector and day. Consistency matters: the index rises, breadth improves, and stocks in the portfolio hold their own bases. When all three are present, a move has more substance than an isolated index push.

Conversely, a break above 1,750 with declining stocks still in the majority should be treated as something to monitor, not a confirmation. Money may be selectively favouring large caps, or the rest of the market may need more time to absorb supply. It would be premature to assign one definitive cause without sector-level flow data. The practical discipline is to follow the signal in each holding rather than use a green index as a reason to chase prices.
Liquidity has to be read in the direction of price
About 756.5 million shares changed hands on 31 July, around 8.5% above the 20-session average of 697.5 million shares. High turnover is often described as a sign of participation, but it is not inherently positive. The relevant question is whether turnover increases as prices rise or fall, and which side breadth favours.
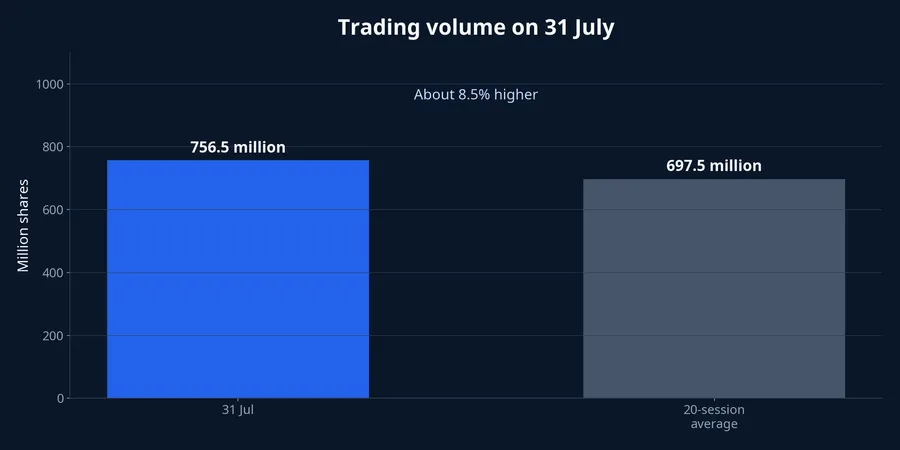
When prices rise, breadth is positive and volume improves, there is a firmer basis for recognising active demand. When prices fall, decliners dominate and volume increases, supply may be building. A sideways market with lighter turnover requires a more cautious conclusion: both buyers and sellers may simply be awaiting a clearer signal. Liquidity is context, not a pre-set “good” or “bad” label.
That distinction matters after a quick rebound. Higher volume in the 31 July decline shows that trading remained active, but it does not prove that sellers have taken control or that buyers are absorbing supply. Subsequent sessions will show whether elevated turnover confirms demand or extends profit-taking pressure. Repositioning an entire portfolio after a single session is usually an overly fast response.
Three scenarios to monitor, not three forecasts
The first scenario is healthy consolidation. VN-Index may move around its current area, daily declines may narrow, advancers may return to balance or a majority, and volume may avoid a sharp jump on red sessions. If the index then clears the area around 1,750 with at least average 20-session volume and positive breadth, the signal becomes more convincing. This is a setting to watch for shares building sound price bases, not an invitation to buy at any price.
The second is an index rise with unhealthy portfolios. It would occur if VN-Index advances while breadth stays weak or turnover is concentrated in large caps. New investors can easily be pulled into a share that has already risen quickly because the index is green. A simpler test is more useful: has the stock under review broken out of its own base on appropriate volume? If not, index strength does not replace the signal from that stock.
The final scenario is a deeper correction. The signs to watch are a close below the area around 1,700, volume above the 20-session average, and continuing dominance by decliners. Those conditions need to appear together before they indicate broadening selling pressure. If the index slips below 1,700 on light volume, it may still be a retest rather than confirmation of a fresh decline. The 1,668.53 level from 22 July becomes the next reference area if conditions deteriorate clearly.
Conclusion: confirmation matters more than prediction
Based on data through 31 July, the most supportable conclusion is that the late-July rebound has not yet become a confirmed new uptrend. This does not rule out further gains. It sets clear conditions for a constructive reading: the area around 1,750 needs to be cleared with improving breadth and without fading volume. A close below 1,700, with rising turnover and decliners in control, would instead make a deeper-correction scenario more relevant.
There is a direct personal-finance implication. Rather than trying to predict whether the next session will be green or red, prepare a short checklist of signals. The index tells investors where VN-Index stands. Breadth tells them how many stocks are moving with it. Liquidity shows the commitment behind the move. When the three agree, decisions have a stronger foundation; when they conflict, waiting for confirmation is a disciplined choice.