
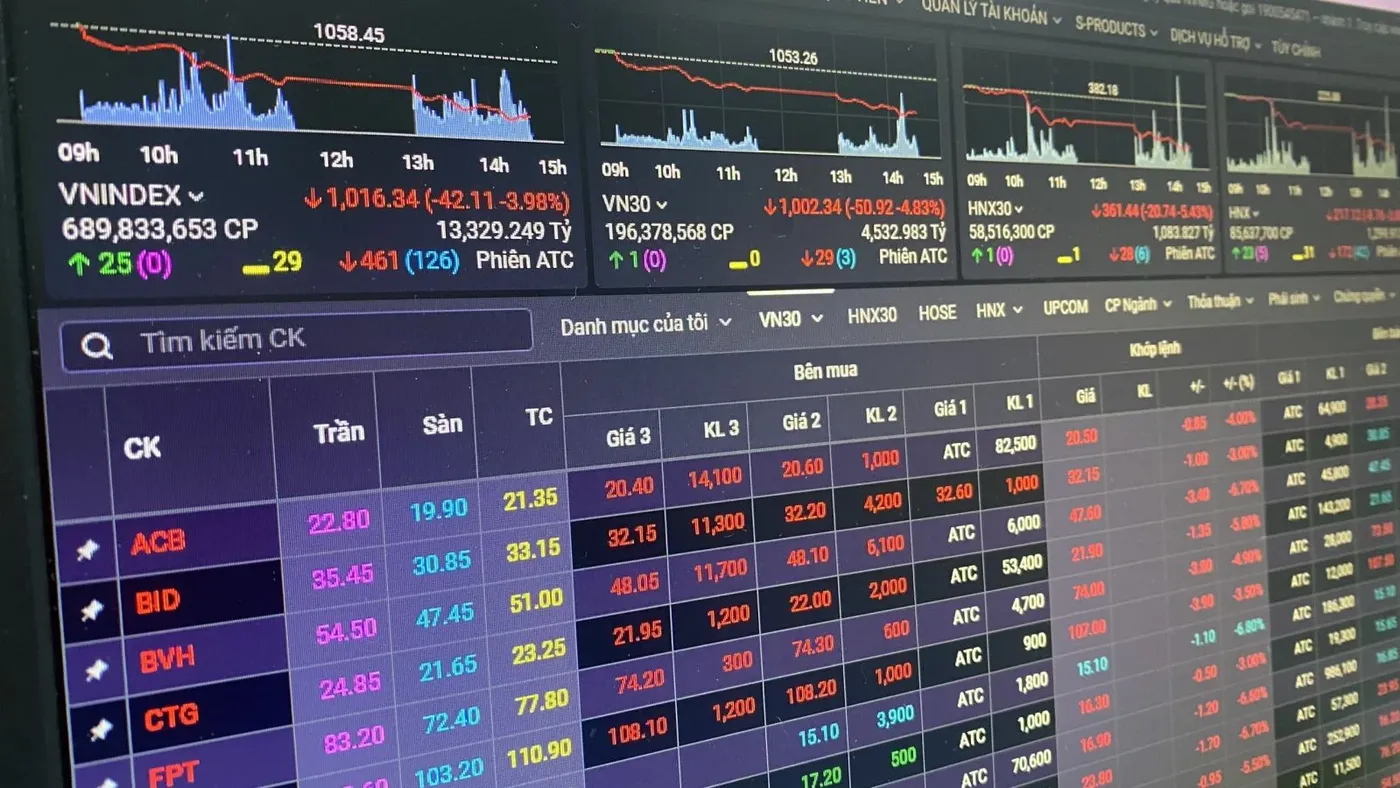

The VN-Index still closed above 1,700, but the more revealing detail from July 31 was not its 8.88-point decline. On HOSE, 208 stocks fell while only 128 advanced. Put simply, the index shows how market capitalisation moved; market breadth shows how many individual shares actually attracted buying interest. Those two pictures can diverge sharply within the same session.
That is not proof that the rebound has failed. The more measured conclusion is that its breadth has not yet been confirmed. Rather than focusing on 1,700 alone, new investors should watch whether gains return across more groups of stocks and whether they last into the close.
An index does not describe every portfolio
The VN-Index closed July 31 at 1,735.78, down 0.51%, with more than 762.4 million shares matched. The 128-to-208 advance-decline split means that for every rising stock, roughly 1.6 fell. A portfolio that is not concentrated in a handful of the largest companies may therefore have felt materially weaker than the index’s sub-1% decline suggests.
The VN-Index is capitalisation-weighted. A small group of large stocks can cushion the index even as most stocks decline. The reverse can happen too: losses in a few heavyweight names can pull the index lower while much of the board remains relatively resilient. Breadth does not replace the index, but it is an essential cross-check against mistaking the behaviour of heavyweight shares for the condition of an entire portfolio.
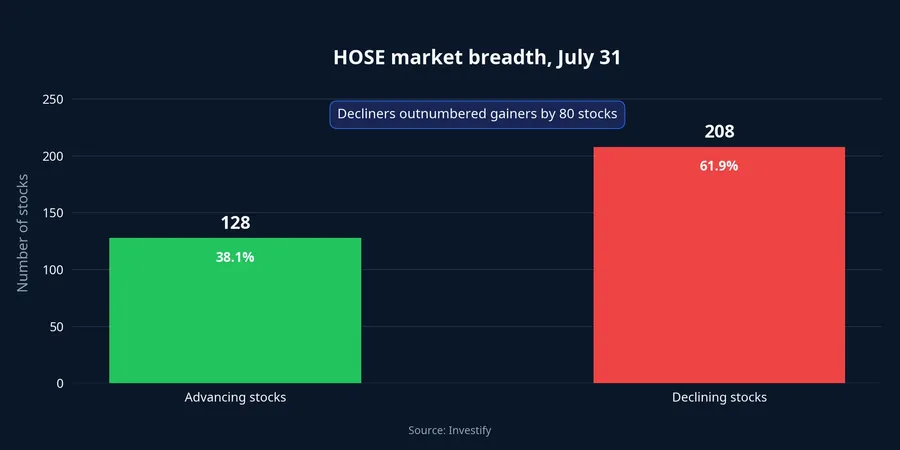
The 1,735.78 close therefore says only that the index stood 35.78 points above the psychological 1,700 level. It does not automatically mean that most stocks are safe, nor does it create demand for the following session. What matters is participation: advancing stocks need to regain the upper hand, and the improvement cannot be confined to a few shares with outsized index influence.
Weakness across all market-cap groups
On July 31, the VN30 fell 0.75%, the mid-cap index slipped 0.49%, and the small-cap index lost 0.57%. The advance-decline split was also negative in each group: VN30 had 10 gainers and 19 losers; mid-caps had 19 gainers and 44 losers; small-caps had 63 gainers and 100 losers. The shared decline indicates that selling pressure was reasonably broad rather than confined to one corner of the market.
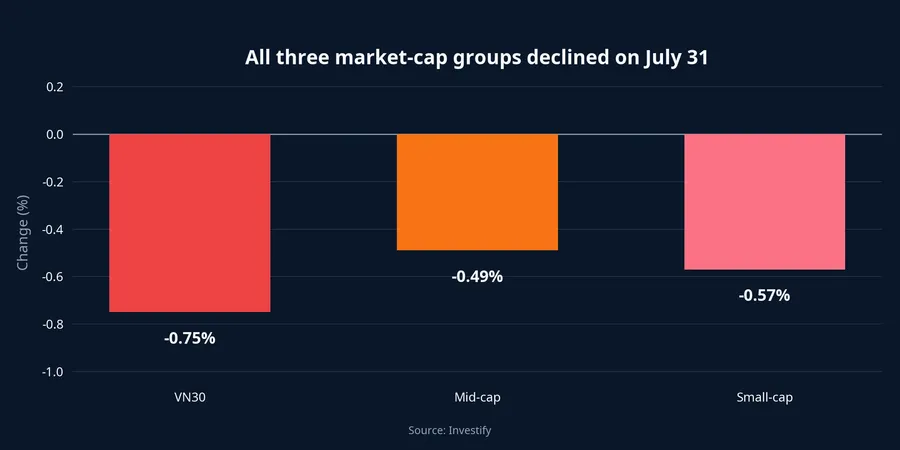
Broad, however, does not mean a rout. All three group indices fell by less than 1%, and their declines were not equally severe. The evidence is more consistent with a session of consolidation or profit-taking after a rapid rise than with a new downtrend inferred from one trading day.
This is why breadth should be treated as a diagnostic rather than a verdict. A weak breadth reading is useful because it asks whether the market’s apparent strength is shared, but it does not tell us which investor sold or why. Earnings news, portfolio rebalancing and normal profit-taking can all shape a single session. The next session’s participation is more informative than an attempt to force a definitive story from one close.
That distinction matters. The VN-Index had gained more than 11 points on July 28, according to VTV, before adding 39.98 points, or 2.35%, on July 30.VTV A pullback after a quick advance is possible. What remains unresolved is whether demand is broad enough to absorb profit-taking and sustain the rebound.
What lower turnover adds to the picture
Matched volume in the VN-Index fell from more than 837.1 million shares on July 30 to more than 762.4 million on July 31, a decline of approximately 8.9%. When prices fall alongside lower turnover, the data do not point to panic selling. Sellers did not expand volume as prices moved down.
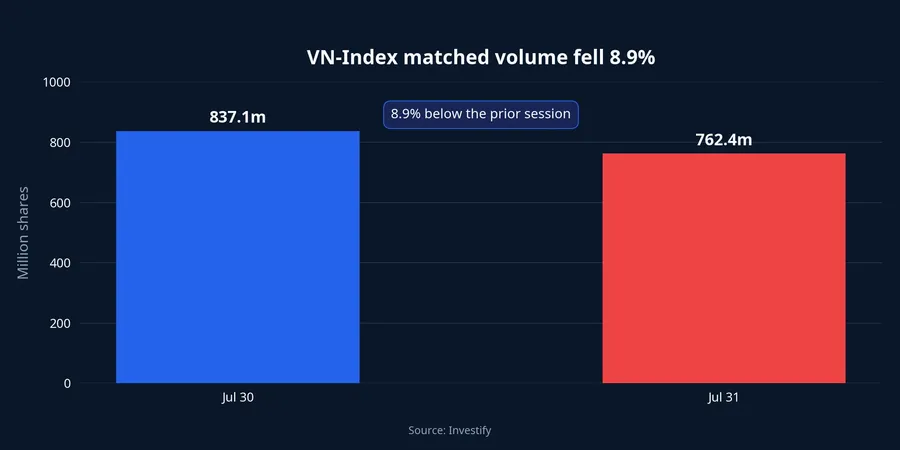
Lower turnover is not automatically bullish, though. It can also mean that buyers are not prepared to bid higher across the board, particularly when decliners still outnumber gainers. A useful reading combines three elements: the direction of the index, the advance-decline balance, and trading volume. None of the three can support a conclusion on its own.
Volume also needs context. A sharp fall with rapidly expanding turnover would suggest a different balance of supply and demand from a modest retreat on lighter activity. The July 31 figures support neither complacency nor alarm: they show a market where the rebound’s participation remains incomplete. That is a more useful description for a new investor than trying to label the day bullish or bearish in isolation.
For example, an index gain while losers still outnumber winners may indicate that the move is concentrated in large-cap stocks. By contrast, an index moving in a narrow range while gainers steadily take the lead and turnover improves is a healthier structure for more portfolios. That is the difference between an attractive index print and a recovery with a broader base.
Three things to watch next session
At the open, watch the relationship between gainers and decliners. A quick index lift in the first minutes can come from only a few stocks. If advancing shares take the lead and retain it through intraday volatility, buying interest is beginning to extend beyond the market heavyweights.
During the session, compare VN30 with mid-caps and small-caps. All three groups declined on July 31. A more credible recovery does not require every stock to rise, but it should show improvement in several groups rather than in a single representative index.

At the close, focus on whether gains can be held. A session that opens positively but steadily loses advancing stocks suggests that demand lacks durability. Conversely, the index may not rise sharply, yet breadth may improve and volume may remain stable. For assessing the health of a rebound, that signal is more useful than a brief breakout.
Giving 1,700 the right role
Round numbers attract attention because everyone can see them. On July 31, 1,700 was a psychological buffer, not an independent buy-or-sell signal. If the VN-Index remains above it while decliners continue to dominate, the evidence still does not support the view that demand has returned to the entire market.
Conversely, if the index trades close to that round number while breadth improves and selling pressure does not widen, a point decline may not describe equivalent weakness across many shares. New investors often fixate on the question of which level holds. The more useful question is how many stocks are holding up alongside it.
The conclusion from July 31 is that the rebound needs further confirmation, not that it has been invalidated. The next session should be read through whether breadth shifts from negative toward neutral or positive, and whether turnover supports that shift. Until both improve together, 1,700 is a reference point for observation, not sufficient evidence of a durable recovery.
That framework also helps keep the decision process proportionate. It replaces the urge to react to a familiar round number with a small set of observable facts: participation, persistence and turnover. The next session will not settle every question about the market, but it can show whether buyers are becoming more broadly willing to support prices. For now, that confirmation is the key signal to monitor.