


VN-Index added 39.98 points on July 30, but the more useful signal is not the headline number alone. Some 287 stocks advanced while 60 declined, so gains were visible across most of the board rather than being confined to a few large names. The index closed at 1,744.66, up 2.35%.VNIndex.ai For newer investors, that distinction matters: index points tell us how far the market moved; breadth tells us how many shares actually moved with it.
The central conclusion is straightforward. July 30 confirmed a broad-based rebound, not a new uptrend. That stronger interpretation needs three things in the following session: participation must remain broad, turnover must not turn into selling pressure, and leading sectors must not all surrender their gains at once.
Breadth answers what the index level cannot
An index can rise sharply and still overstate the health of the wider market if most of the move comes from a small set of heavyweights. VN-Index is market-capitalisation weighted, so price changes in its largest constituents carry far more influence than changes in smaller companies. A gain of nearly 40 points therefore does not, by itself, establish that the market is broadly healthy.
July 30 was different because advancers outnumbered decliners by nearly 4.8 to one. There were 18 ceiling-price stocks and only one floor-price stock, while FRT, VIX, GEL and CTS were among the names that rose to their daily limits on HOSE.VNIndex.ai This does not mean every stock has the same outlook. It does show that intraday demand reached several sectors and stock-specific narratives, a healthier pattern than an index that is green while most portfolios are not.
Breadth is especially useful because it keeps investors from treating the index as a single tradable object. A portfolio made up mostly of small and mid-sized companies can have a very different day from VN-Index, even when the headline looks powerful. Checking the advance-decline balance alongside the index helps separate broad participation from a move that is concentrated in names with the highest weight. It is a description of the day’s internal structure, not a price target.
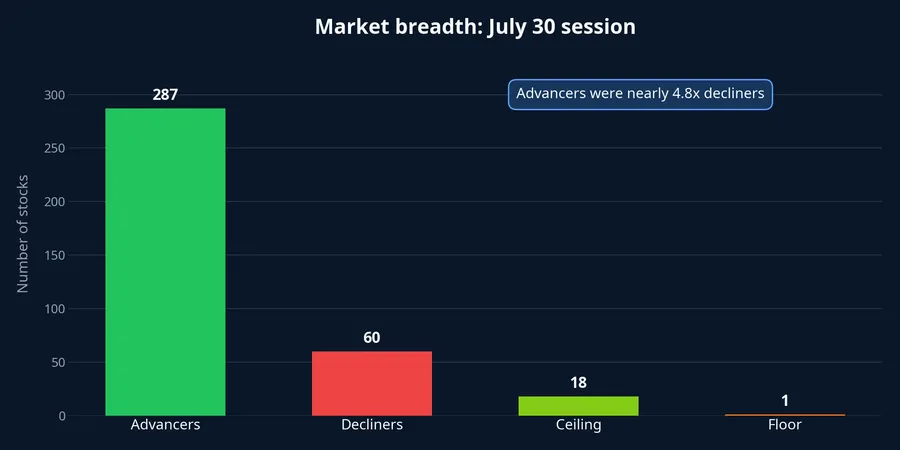
Healthy breadth does not erase the influence of the largest stocks. VHM contributed 6.83 points to the index advance, VCB added 3.34 points and BID added 2.76 points; together, the three accounted for approximately 12.93 points.VNIndex.ai Both observations can be true at once: large caps provide the index lift, while a large number of rising shares confirms that demand was not limited to them.
Higher turnover needs context
Trading volume on July 30 exceeded 857.4 million shares, about 26.9% above the previous 20-session average of nearly 675.8 million shares. Prices rose, advancers dominated and activity expanded at the same time. That combination points to more active buying than the market had seen over the preceding few weeks.
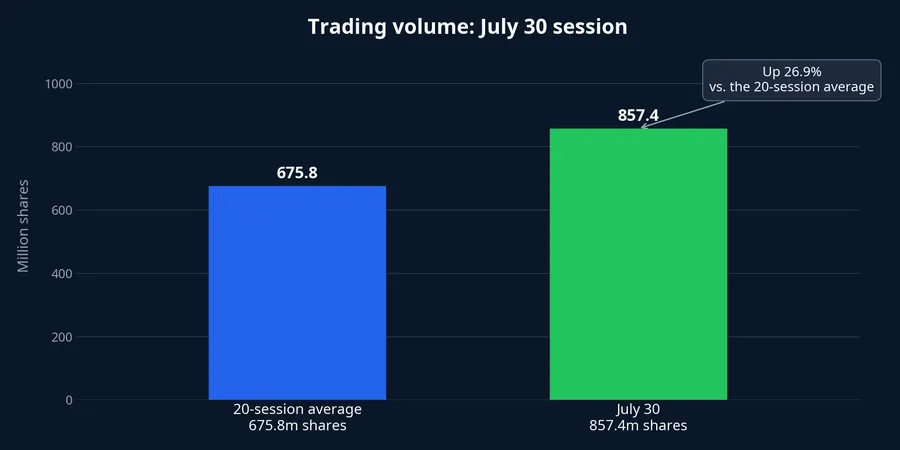
Turnover, however, is not a one-way vote of confidence. A busy rising session can reflect fresh money willing to buy at higher prices, but it can also include holders selling into improved sentiment. Reading 857.4 million shares as proof of a durable advance would therefore go beyond the evidence.
The comparison with the 20-session average is useful for scale, not for declaring a verdict. Markets trade at different activity levels across different phases, and a larger figure does not identify who initiated each transaction. What matters next is the relationship between price, breadth and volume. That relationship is more informative than volume in isolation because it distinguishes absorption of supply from a distribution-heavy session.
Think of volume as traffic on a bridge. Heavy traffic says the bridge is being used, but it does not tell us whether vehicles are moving smoothly in one direction or backing up. In the July 31 session, high volume would be more constructive if the index holds most of its gain and advancers remain dominant. If prices fade as decliners broaden, supply is gaining the upper hand over demand.
Three observations for the next session
First, track breadth through the session rather than only at the opening. If VN-Index stays positive while declining stocks gradually outnumber advancing stocks by the close, the advance is narrowing into a small group of big names. That would not invalidate July 30, but it would lower the quality of the rebound because most portfolios would no longer be participating.
Second, watch how prices respond when investors take profits. A modest pullback on contracting volume is not automatically negative; it may simply mean selling is not urgent. The more cautionary combination is falling prices, dominant decliners and expanding volume. Together, those signals suggest selling pressure has spread beyond isolated stocks.
This framework also avoids an unhelpful binary reading of a red or green close. A slightly negative index can still leave a constructive footprint if market breadth is reasonably balanced and the previous session’s gains are largely retained. Conversely, another positive close may be less reassuring if leadership becomes extremely narrow. The goal is to read the quality of the move, rather than to force every session into a simple bullish or bearish label.
Third, assess the role of the leaders. On July 30, VHM and bank stocks including VCB, BID, CTG and TCB were important contributors, while consumer, retail and securities names also posted strong gains.VNIndex.ai The market does not require every group to rise together. It is more useful when one group can take over while another pauses, as that indicates rotation within the market rather than money leaving it altogether.
Recent history is context, not a formula
Before July 30, VN-Index had recorded five sessions in 2026 with gains above 2% for which next-session data were available. Four of those next sessions declined and one rose; the average next-session move was a fall of approximately 0.48%. That is a sample of only five observations, far too small to turn into a probability forecast for July 31.
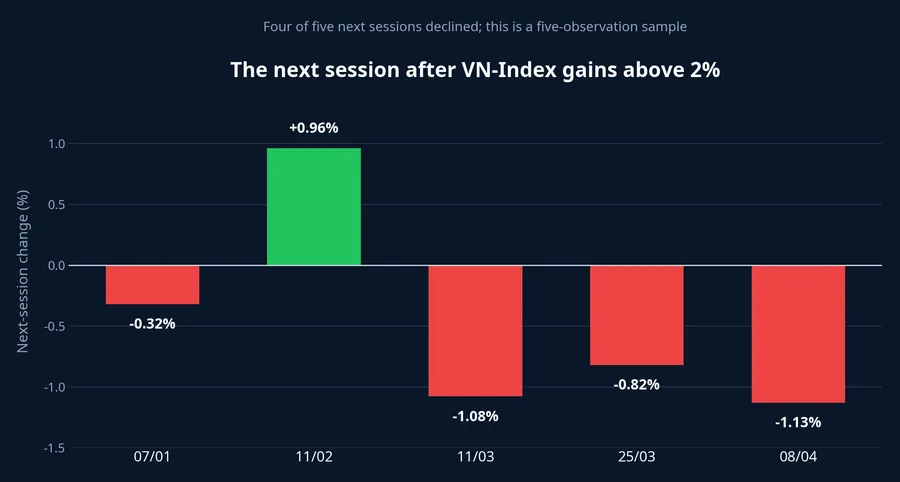
What the small sample can do is illustrate a normal market mechanism. After a strong daily gain, some investors who are sitting on short-term profits may consider selling. The next session is consequently a useful test of demand. If the market absorbs new supply without a rapid deterioration in breadth, that conveys much more than another index gain accompanied by a narrow board.
There are several reasons why individual next-day outcomes can differ, including the direction of the broader trend, the makeup of the leading groups and the flow of orders during the session. The five observations do not isolate those drivers, so they should not be treated as proof that a decline is due. Their value lies in setting a sensible expectation: profit-taking after a strong day is plausible, and the market’s response to it contains information. That is a more disciplined use of recent history than turning it into a trading rule.
Conclusion: wait for confirmation in market structure
July 30 deserves to be recognised as a rebound with a broader base than one driven solely by index heavyweights. It does not mean risk has disappeared or that a fresh uptrend has already formed. The balanced reading is that demand returned for the day, while its durability needs another trading session to be tested.
The key signals for July 31 are whether breadth remains tilted toward advancers, whether volume accompanies the market's ability to hold its gains, and whether money rotates among leading groups. Those data points cannot settle the direction of an entire cycle, but they can distinguish a rebound that is absorbing supply from a short-lived burst of enthusiasm.