
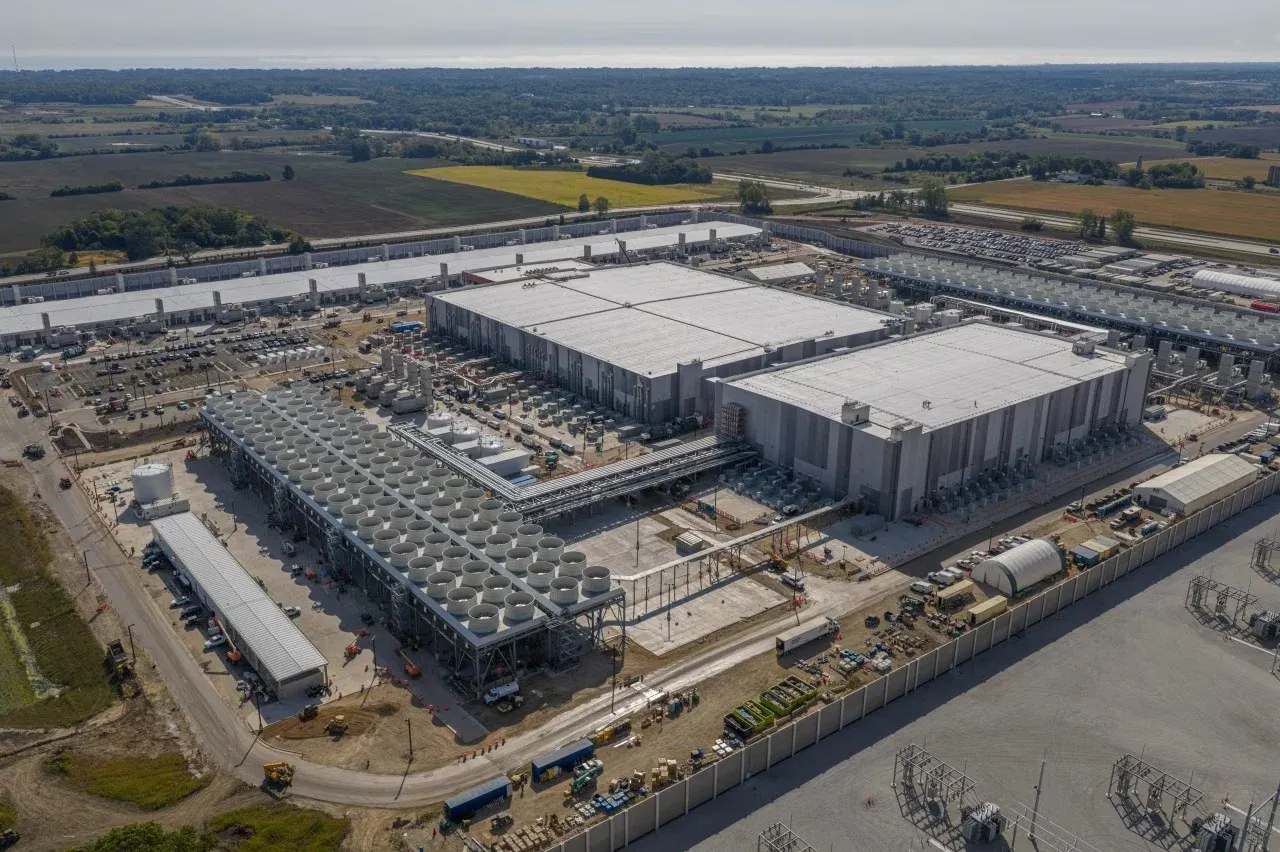

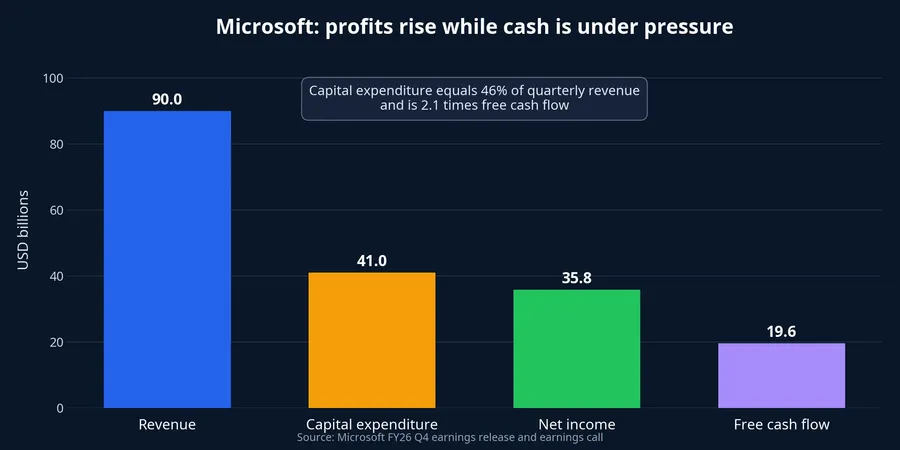
Microsoft committed $41 billion to infrastructure in a single quarter, almost half of the revenue it generated in the same period. That scale can make it seem as though profit should immediately come under pressure. The quarter ended June 2026 tells a more nuanced story: revenue reached $90 billion, operating income was $40.6 billion, and reported net income was $35.8 billion.Microsoft
There is no contradiction here. Infrastructure investment creates a lag between the cash leaving the business, the expense entering the income statement, and the new capacity producing revenue. Microsoft has early evidence that new Azure capacity is being absorbed. Still, free cash flow must catch up in subsequent quarters if the positive case is to hold. That is a more meaningful test than a single quarter's net income.
Capital expenditure is not the same as expense
When Microsoft buys servers and GPUs or builds data centres, much of that initial outlay is recorded as an asset on the balance sheet. The expense is then recognised gradually through depreciation while the asset is used. A large investment can therefore reduce cash in the current quarter without imposing an equivalent immediate reduction in accounting profit.
Microsoft reported $41 billion of capital expenditure, while cash purchases of property and equipment were $35.8 billion. That difference is not an inconsistency: capital expenditure captures the scale of capacity commitments, while the cash-flow statement records money that actually left the company during the period. Finance leases can also make the two measures diverge. Amy Hood, Executive Vice President and Chief Financial Officer of Microsoft Corporation, said roughly two-thirds of quarterly capital expenditure went to short-lived assets, mainly CPUs and GPUs; finance leases tied chiefly to large data-centre sites totalled $5.6 billion.Microsoft
For newer investors, this distinction matters. Profit measures the value a company generated under accounting rules in a period. Cash flow shows the resources left after paying for machines and infrastructure. The measures are complementary, but neither can replace the other.
Azure provides the first business evidence
Accounting explains why profit has not yet carried the full weight of the investment. It does not establish that the investment is effective. The evidence must come from how quickly Microsoft brings infrastructure into service and turns that capacity into revenue.
Azure and other cloud-services revenue rose 43% year on year in the quarter. Microsoft Cloud generated $59.3 billion of revenue, up 27%. Across the fiscal year, Azure revenue exceeded $100 billion for the first time and grew 41%.Microsoft These gains do not prove that every dollar of investment is already earning an adequate return. They are, however, consistent with demand absorbing some of the new capacity.

Satya Nadella, Chairman and Chief Executive Officer of Microsoft Corporation, said the company added 31 data centres in the quarter and 88 across the fiscal year. Microsoft also brought one gigawatt of capacity online in the quarter. It said the time from GPU delivery to serving customers in major regions fell by nearly 50% during the fiscal year.Microsoft The story is therefore not just a construction plan; some of the new infrastructure has entered service.
At the application layer, Microsoft 365 Copilot surpassed 30 million paid seats, and the number of paid seats added in the quarter was more than double the prior quarter's additions.Microsoft That is a meaningful adoption signal. Microsoft has not separately disclosed Copilot revenue or profit, however, so it is not possible to assign the quarter's profit growth directly to that product.
That distinction protects the analysis from a common shortcut. Seat growth can confirm that customers are willing to adopt a product, while revenue per seat, service cost, and retention determine whether the product strengthens economics. Those figures are not available in the disclosure. Copilot therefore belongs in the demand evidence, rather than being treated as a settled explanation for the quarter's profit.

Net income does not tell the whole operating story
Reported net income rose 31% year on year. Taken alone, that might suggest Azure and Copilot have already absorbed the entire infrastructure bill. The data do not support such a firm conclusion, because results also included a $3.2 billion gain related to Microsoft’s Anthropic investment and other discrete items.Microsoft
On Microsoft's presentation excluding the OpenAI investment effect, net income grew 22% year on year. Operating income rose 18%, matching revenue growth. That is a more cautious reference point for the quarter's core operating health because it is less exposed to investment gains.
Company-wide gross margin was 67%, below the prior-year level. Microsoft attributed the change to a higher Azure mix, continued AI infrastructure investment, and greater product usage.Microsoft A lower margin is not automatically negative. It shows that capacity expansion has a cost, and operational efficiency must keep offsetting that cost if profitability is to be defended.
Free cash flow asks the harder question
Operating cash flow was $55.4 billion this quarter, up from $42.6 billion a year earlier. But purchases of property and equipment rose from $17.1 billion to $35.8 billion. Free cash flow consequently fell from approximately $25.6 billion to $19.6 billion.Microsoft
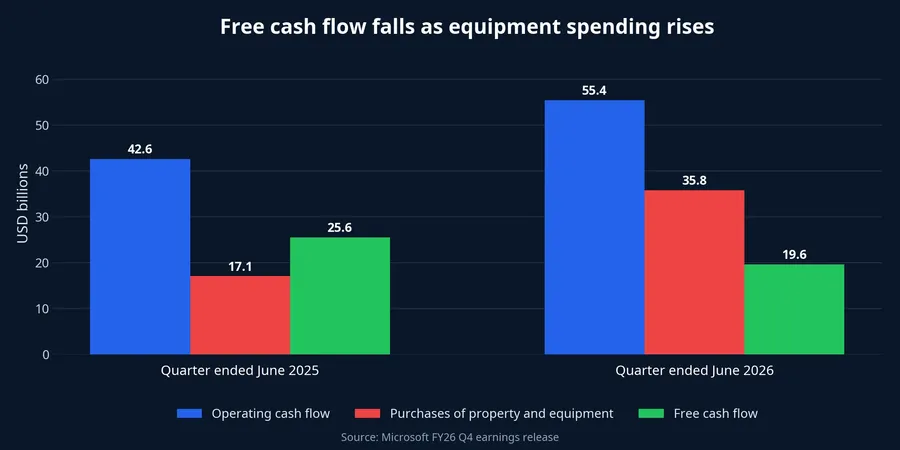
This is where the growth case has to answer in cash. Positive free cash flow still indicates that Microsoft can self-fund a substantial share of investment. The decline also shows that new capacity is demanding more capital than it is generating in cash in the short term. That can be normal in a major build-out, but it should not be obscured by the rise in reported net income.
There are several plausible readings. In the constructive case, Azure continues to grow quickly, capacity fills, and capital expenditure settles, allowing free cash flow to recover. In the more cautious case, Azure growth slows while investment remains elevated, extending the gap between accounting profit and cash. The current report offers early support for the first outcome, but does not eliminate the second.
Watch conversion, not just the size of the spend
Management expects fiscal 2027 capital expenditure to be higher than the prior year, with first-quarter spending expected to exceed $50 billion. It also expects full-year revenue and operating income to grow by double digits, operating margin to decline by less than one percentage point, and free cash flow to remain positive.Microsoft This is management guidance, not an outcome already delivered.
The thesis from this quarter is straightforward: large infrastructure spending alone is not enough to conclude that Microsoft is overspending, because Azure is still growing quickly and new capacity has entered operation. Neither is accounting profit the final proof of efficiency. Upcoming reports need to answer whether Azure can sustain growth, margins can stabilise, and free cash flow can recover as capacity is utilised. If those three measures improve together, today's investment will have a stronger claim to being a platform for future revenue.