


FRT hit its daily ceiling in the morning session on July 30, reaching VND 116,300, up 6.99% from the prior session. That move can bring Long Châu back onto investors’ radar, but it does not by itself prove the quality of the pharmacy chain’s growth. For an expanding retailer, the more useful question is whether each new outlet produces incremental revenue, profit and cash flow.
This is where newer investors can easily get tripped up: store count rises, so the business must be getting stronger. Outlet count describes geographic expansion. It does not tell us whether stores have matured, whether customers return, or whether the cost of supporting the network is rising faster than sales. The honest conclusion today is to wait for fresh operating data before judging the quality of Long Châu’s expansion.
A price move cannot replace operating evidence
A share price captures the market’s expectations at a particular moment. Those expectations may reflect earnings, the outlook for pharmacy retail, short-term flows, or information that investors are waiting to confirm. With several plausible explanations, it would be premature to attribute FRT’s move entirely to Long Châu without new disclosures that separate the contribution of each business.
That does not make the limit-up session meaningless. It shows that the stock is drawing closer attention and gives investors a reason to revisit the assumptions behind its growth story. Price is a prompt to ask questions; an operating report is where those questions can be answered.

Put simply, a chain can grow in two ways. It can add outlets, creating more places for revenue to occur. Or its established outlets can sell more, serve more customers, or achieve a higher average basket value. These drivers often coexist, yet their implications for profitability and funding needs are very different.
Why outlet count alone says little about efficiency
Think of a new pharmacy as a newly opened neighborhood shop. In its first months, it has to build customer habits, refine its merchandise mix, hire and train staff. Revenue may not immediately reflect its longer-term potential, while rent, inventory and operating expenses begin from day one.
If a company opens many outlets at once, average sales across the network may be diluted by immature stores. That is not necessarily negative. Conversely, a higher average does not automatically mean every store is selling better: the location mix, closures of weak outlets, or changes in merchandise can all shape the result.
That is why same-store sales, meaning revenue from outlets open long enough for like-for-like comparison, is the more revealing measure. It separates “opening more” from “selling better.” When mature-store sales rise steadily, the network has stronger evidence that it is absorbing real demand rather than simply spreading across more locations.
Four signals should be read together
You do not need a long list of technical terms to follow a retail chain. Start with the four groups of indicators below. They are like the four legs of a table: if one is missing, any conclusion on growth becomes less stable.
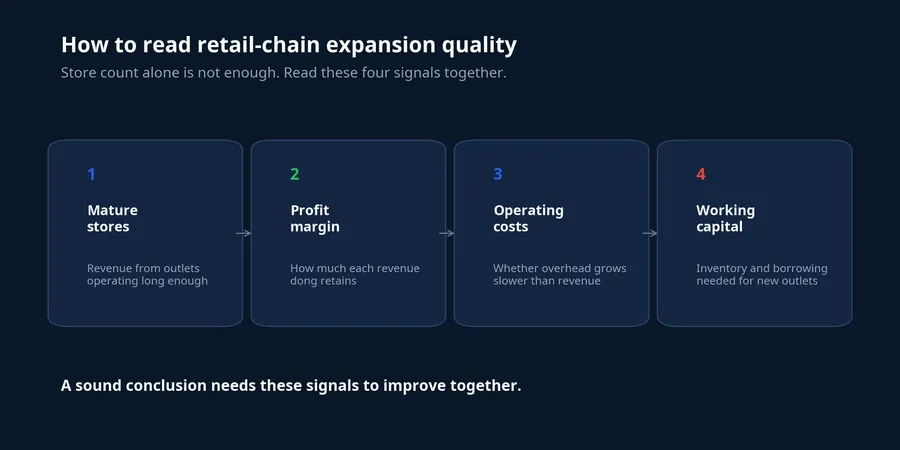
First, look at same-store sales. If total revenue rises while this metric is flat or falls, much of the growth may be coming from new outlets. The model may still be sound, but investors then need a closer view of the time to break even and the capital required for each new site.
Next comes profit margin. High revenue does not equal high quality if the chain relies on heavy promotions, faces higher cost of goods, or has swelling staff expenses. Margin shows how much of each dong of revenue remains to cover costs and create profit. A strong chain usually grows sales while preserving its margin as it scales.
The third group is operating cost. Stores, logistics, technology and management all require spending. When revenue rises but selling and administrative expenses rise faster, greater scale can simply make the organization heavier. When those expenses grow more slowly than revenue, the business may be using its existing infrastructure more effectively.
Finally, consider working capital. A pharmacy needs enough inventory breadth to meet demand, but inventory also ties up cash. More openings can mean more stock, receivables and sometimes more borrowing. Profit on the income statement therefore needs to be read alongside operating cash flow and inventory growth, rather than as a single bottom-line figure.
Do not confuse average sales with mature-store health
Average revenue per outlet is intuitive but limited. It divides total revenue by the number of outlets in a period, mixing long-established stores with newly opened ones. When a network expands quickly, the denominator rises before new locations have had time to generate their full sales potential. The average can therefore understate the health of mature stores.
The reverse is also true. A better average can reflect the closure of weaker sites, a changed product mix, or a different number of operating days in the period. Investors should not turn one average figure into a verdict on underlying demand. It matters whether the company clearly discloses same-store cohorts, the time to break even, and investment per new outlet.
The illustration below separates those intuitions. Network coverage creates opportunities to reach more customers; performance at each location determines whether that opportunity becomes profit. A durable chain needs both, and its reporting should demonstrate that they reinforce each other.

FPT Shop is a reminder to read each segment separately
FPT Retail is more than Long Châu. When assessing the parent company, investors should separate the outlook for pharmacy retail from consumer electronics, because their merchandise models, demand cycles and cost structures differ. Improvement in one segment can support consolidated results, but it does not automatically mean the other segment’s operating drivers have strengthened.
That comparison is useful because it guards against applying one indicator to every retail format. An electronics store can be heavily affected by product cycles, promotional programs and discretionary spending. A pharmacy depends more on population density, trust, assortment and inventory management. Both may report revenue per outlet, but the economic story behind the figure can be entirely different.
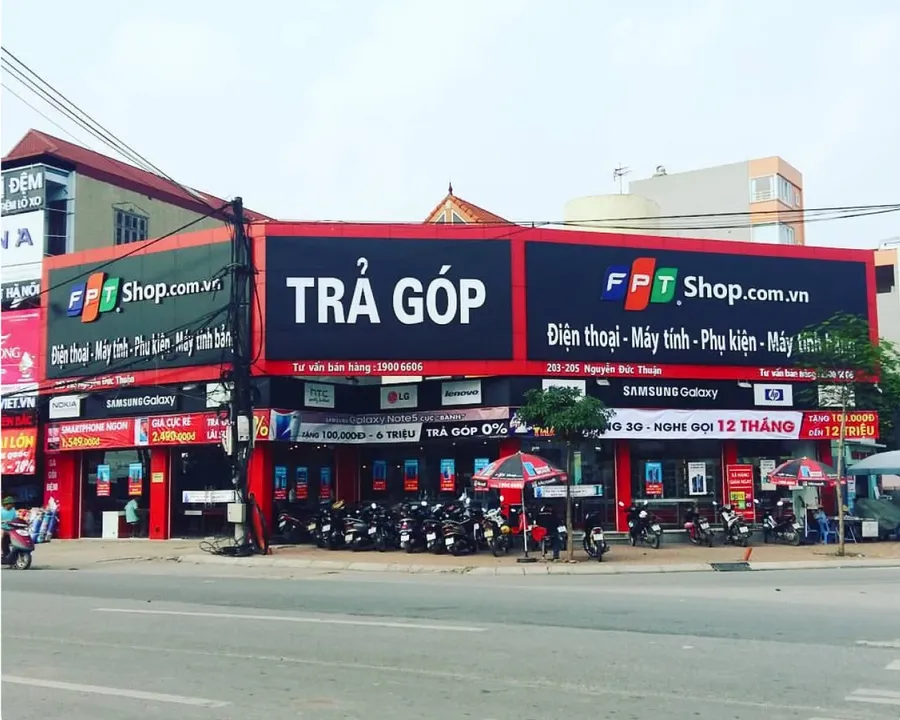
Read each segment first, then put the parent-company picture together. If Long Châu adds outlets, look specifically at its mature-store performance and margin. If FPT Shop changes its footprint, look separately at its revenue, costs and technology demand. This approach is slower than chasing one headline number, but it materially reduces the risk of mistaking correlation for the source of growth.
What the next report needs to answer
At this point, updated evidence is not sufficient to say whether Long Châu is growing mainly through expansion or mainly because each pharmacy sells better. That is not a weakness in the analysis. It is a boundary that should be respected when reading the data. Older quarterly figures cannot substitute for operating signals when the stock has just moved sharply.
In the next report, the items worth watching are same-store sales, profit margin, the growth rate of operating expenses, cash flow from operations and working-capital needs. A single signal is rarely decisive. If the indicators improve together, the expansion story will have firmer foundations. If outlet count grows while mature-store revenue, margin or cash flow weakens, the market will need to reassess the cost of growth.
FRT’s limit-up session is a useful reminder to return to the basic question: does each new outlet create value, or simply add scale? A reliable answer will come from a new set of operating data, not from one trading session. Until then, investors are better served by tracking the quality of these four signals than by letting outlet count drive the entire conclusion.