


Money is leaving investment funds more slowly than it did in the first quarter, but the direction has not changed. For anyone holding fund certificates, that distinction matters: a gentler redemption pace means selling pressure has eased. It does not by itself mean investors have returned as buyers.
FiinGroup data show that Vietnam-based investment funds saw nearly VND 20,200 billion in net redemptions in the first half of 2026. Q2 alone accounted for nearly VND 6,000 billion, down 57.9% from Q1.Thời báo Tài chính Việt Nam The pace has clearly changed. Yet Q2 was still the sixth consecutive quarter in which the industry recorded net outflows.Thời báo Tài chính Việt Nam
Think of it as a water tank that is still draining, only with the tap turned down. That is why a large headline number should not drive a quick decision. The more useful questions are what kind of fund you own, how it has performed and why money may be moving.
A slower outflow is not a reversal
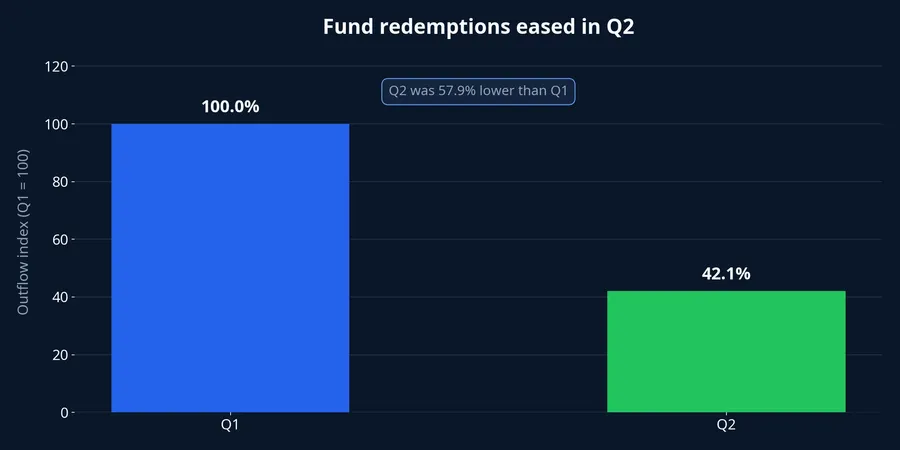
The normalized chart puts Q2 redemptions at 42.1% of Q1. That is less negative than the start of the year and would become more meaningful if it persists in subsequent reports. But a long-running negative trend cannot be declared reversed simply because one quarter was less negative than the prior one.
A recovery needs at least two developments: net flows must stop being negative or turn positive for several reporting periods, and fund performance needs to improve enough to retain certificate holders. The current report shows that the first condition has not yet been met. The most accurate conclusion is that pressure is easing while the trend still requires confirmation.
It also avoids a common mistake. Money redeemed from funds has not necessarily left Vietnam's equity market. Some may have moved into direct shares, deposits, cash or another fund. Fund-flow data describe activity inside the fund channel, not every allocation made by retail investors.
Equity funds carried the heaviest pressure
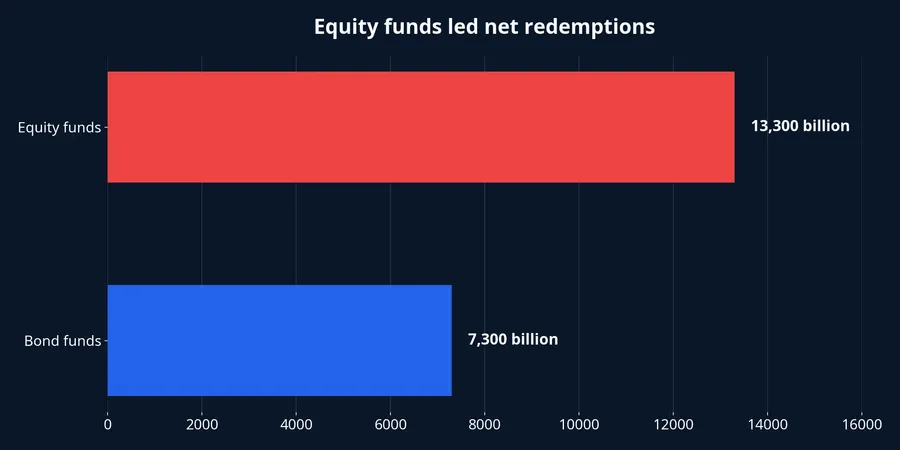
Equity funds saw nearly VND 13,300 billion in net redemptions in the first half, well above the roughly VND 7,300 billion reported for bond funds.Thời báo Tài chính Việt Nam The source rounds its category figures, so the two amounts should not be added to derive an exact industry total.
Performance is part of the explanation. Average equity-fund returns moved from a 0.8% gain in the first half of 2025 to a 2.7% loss in the comparable period of 2026. Fifty-six of 88 funds posted negative returns, or about 64% of the sample.Thời báo Tài chính Việt Nam
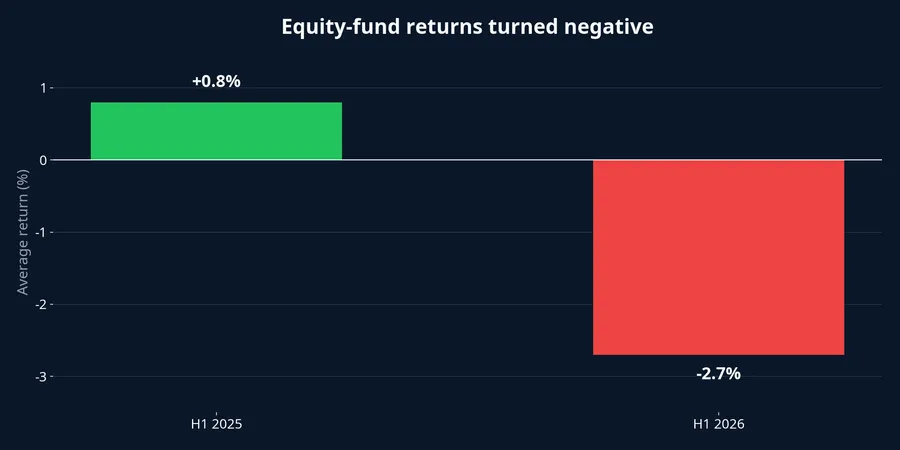
That relationship should not be presented as the sole cause. Weak returns can prompt redemptions, but portfolio rebalancing, a preference for self-directed investing and movements in the underlying market may also matter. The available data do not apportion the effect of each factor.
June contained a more encouraging detail. The number of equity funds with negative returns fell to 49 of 88, from 72 of 84 in the previous month, while 28 funds moved from a loss to a gain.Thời báo Tài chính Việt Nam It is a signal worth watching, not evidence that flows have already turned. A single month of better performance and a durable flow recovery are different things.
Positive returns did not prevent bond-fund redemptions
Bond funds show why return alone is not enough. They had roughly VND 7,300 billion in net redemptions in the first half of 2026 even as their average return reached 3.1%, above 2.97% a year earlier.Thời báo Tài chính Việt Nam Twenty of 28 bond funds recorded net redemptions, while 15 of 27 delivered returns between 3.1% and 4.7%.Thời báo Tài chính Việt Nam
The comparison with bank deposits is intuitive. When the return gap is modest, investors also weigh management fees, redemption timing, NAV volatility and their need for cash. The source places average 12-month deposit rates at Vietnam's four state-owned commercial banks at about 2.9%, close to the 3.1% average bond-fund return.Thời báo Tài chính Việt Nam
That does not make bond funds inferior to deposits, because the products have different structures and risks. It shows that holders do not compare one return number in isolation. They compare return after fees, access to cash and acceptable volatility against their own financial goal.
NAV has two moving parts
By the end of June, aggregate NAV across securities investment funds was about VND 263,700 billion, down 1.4% from the end of May and 7% from year-end 2025. It was 12.4% below the August 2025 peak, a decline of roughly VND 37,200 billion.Thời báo Tài chính Việt Nam
A falling NAV is not identical to cash leaving the fund. Net asset value changes because of both certificate redemptions and price movements in the stocks and bonds a fund holds. A fund can see outflows without much NAV decline if its assets rise, and the reverse can also happen. Reading net flows together with performance is more informative than looking at size alone.
ETFs illustrate why the comparison window matters. In early July, ETFs had VND 819 billion in net redemptions, up 98.6% from June. Yet cumulative net redemptions from the start of the year were VND 5,300 billion, down 65.9% from 2025.VnEconomy The month-on-month figure says recent pressure increased; the year-on-year figure says cumulative withdrawals have eased. Both can be true because they answer different questions.
What to read in the next report
For a newer investor, the task is not to predict where money will go from a single industry total. Compare your fund with its peer group, assess performance over your actual holding period and understand its redemption process. Open-end funds typically need several business days to process a transaction, while listed ETF certificates can trade during the session. That liquidity difference directly shapes how holders behave.
It is equally important to compare like with like. An equity fund should be assessed against the relevant equity benchmark and against funds with a similar mandate, rather than against a deposit rate. A bond fund deserves comparison with deposits and peer funds of similar risk, but its published return should be read after considering fees and the investor's expected holding period. The label “balanced” is not a guarantee of a smaller loss in every market phase, either: the outcome depends on how that particular fund allocates between shares and fixed-income instruments.
One report is a snapshot, not a verdict. A sequence of reports can reveal whether the improvement is broadening across funds or merely concentrated in a few portfolios. That is especially useful when headline NAV and net-flow figures point in different directions. Reading both measures together prevents an investor from mistaking a market-price move for a change in client commitment, or the other way around.
The thesis is straightforward: fund outflows slowed in Q2, but there is not yet evidence of a recovery. Future reports will be more convincing if they show further narrowing redemptions, more funds with improving performance and stable NAV supported by both flows and asset prices. Those are the signals that can clarify the trend, not a promise that money will enter every fund category.