

Intel reported a $11.033 billion net loss in the second quarter of 2026. Taken in isolation, the bottom line looks alarming. Read in the right order, however, the report tells a more nuanced story: operations generated $1.796 billion of income, while the largest loss item was an accounting liability that rose with Intel's share price. Intel
The thesis for the quarter is straightforward. Intel's operations have recovered, but its turnaround is not complete. A non-cash revaluation explains why net income and core operating results moved so far apart. Yet Intel Foundry remains loss-making, and the Ireland transaction has reduced the company's cash resources. This is a useful case study in separating reported earnings, adjusted earnings and cash.
An accounting loss is not an operating expense
Under Intel's Secure Enclave agreement with the US Department of Commerce, the company issued shares into an escrow account. Those shares are released as Intel meets conditions and receives funding. At quarter-end, 143 million shares remained in escrow, after 7 million shares were transferred during the quarter. Intel
The structure requires Intel to account for a derivative liability. If remaining shares are not released at the end of the performance period, half may be delivered to the Department of Commerce without additional consideration to Intel and the other half cancelled. As the share price rises, the value of the potential delivery obligation rises too, so Intel must remeasure it at fair value each reporting date.
That remeasurement produced a $12.529 billion loss in interest and other income during Q2. The related liability had a fair value of $15.6 billion at quarter-end. It was not a payment to suppliers or a cost of making chips. It was a change in the present value of an obligation tied to Intel shares. Intel
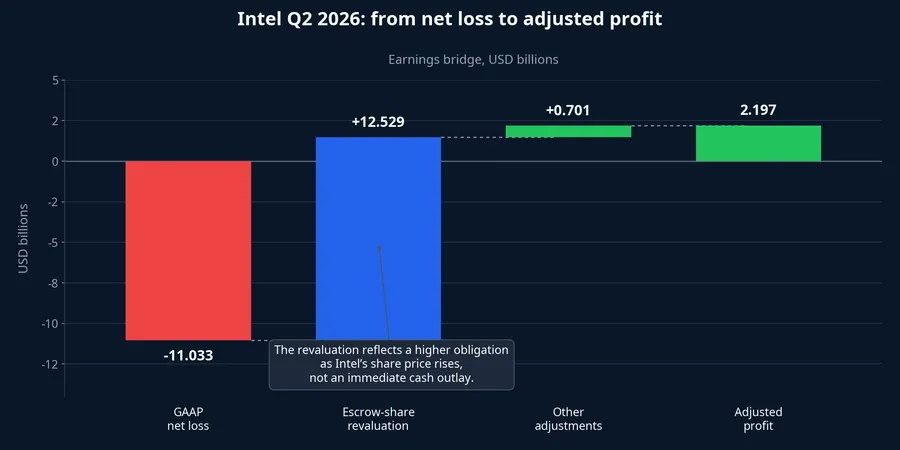
The bridge explains how two seemingly conflicting figures can both be accurate. In its six-month cash-flow statement, Intel added back $13.619 billion of non-cash revaluation losses when reconciling accounting income to operating cash flow. That does not eliminate the obligation's risk, but it does show that the Q2 net loss is not a direct measure of cash leaving the company. Intel
Intel also excludes the item from its adjusted result, which was $2.197 billion. Adjusted earnings are useful for comparing operations across periods, but they are a management-defined presentation. New investors should not choose one figure and discard the other: GAAP earnings show the scale of the obligation, while adjusted earnings help isolate the day-to-day business.
The practical reading order matters. Start with the operating line to see whether the business is producing a better margin. Then reconcile unusual items to understand why the bottom line diverges. Finally, test that reading against cash flow and debt. A non-cash item can be economically important without being evidence that the company paid the same amount in the quarter.
Operational improvement has specific evidence
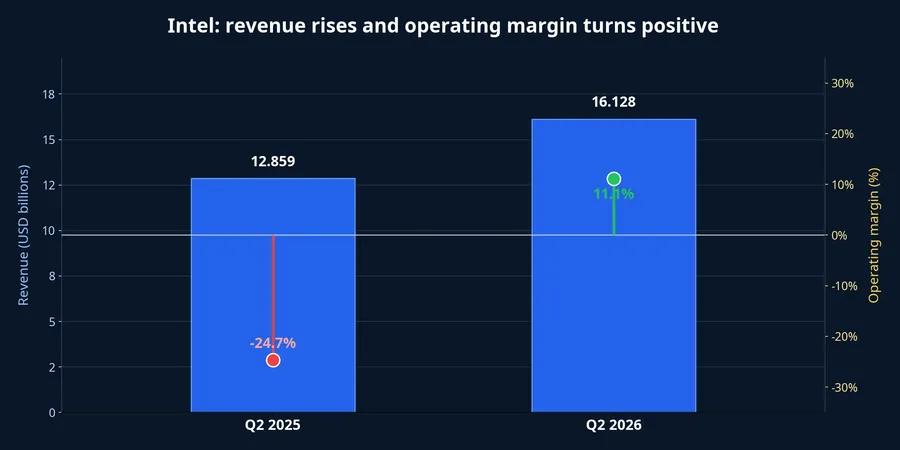
Q2 revenue reached $16.128 billion, up 25% year over year. GAAP gross margin rose from 27.5% to 40.4%, and operating margin moved from negative 24.7% to positive 11.1%. Those measures are formed before the share revaluation, making them more direct evidence of improvement in sales, product mix and costs. Intel
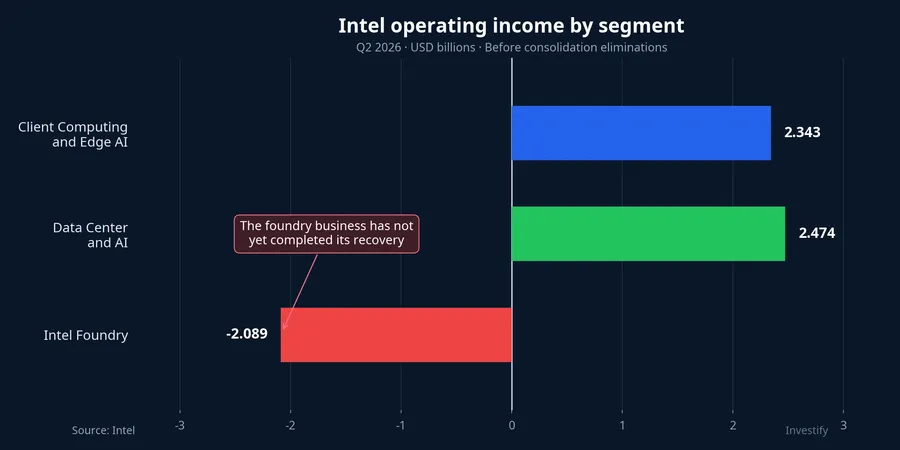
The strongest contribution came from Data Center and AI, where revenue was $6.262 billion, up 59%. Server average selling prices rose 48% and unit volume increased 9%, so growth was not simply a matter of selling pricier products. Segment operating income was $2.474 billion. Intel
Client Computing and Edge AI produced $8.877 billion in revenue, up 13%. The picture here was less balanced: average selling prices rose 27%, while volume fell 8%. A richer product mix and pricing actions supported revenue, but weaker unit volume means mainstream demand has not confirmed the same strength seen in servers. Intel
Intel Foundry remains the missing piece
At segment level, Intel's two product businesses generated operating income, while Intel Foundry posted a $2.089 billion operating loss. That was narrower than the $3.168 billion loss a year earlier, but it is not yet break-even. Intel
Foundry revenue was $5.765 billion, but most of it came from transactions with Intel's product businesses. Revenue from external customers was only $293 million. The distinction matters: internal manufacturing can support operations, but a foundry model is truly market-tested when it wins external customers and narrows losses on a durable basis. Intel
It would be too strong to say that server demand alone caused the company's recovery. The report shows changes in price, volume and product mix, while cost items also helped operating margin. The available evidence confirms an operational shift, but it does not allocate the full contribution to one product or one end market.
That distinction also prevents an overly optimistic reading of segment reporting. Internal foundry revenue can be economically useful, but it is not the same signal as third-party demand for Intel's manufacturing services. The next reports need to show whether external revenue and margins progress together, rather than merely whether a large internal revenue figure is maintained.
Cash flow sets the boundary for optimism
Q2 operating cash flow was $7.006 billion, up from $2.050 billion a year earlier. Gross capital spending fell from $4.492 billion to $2.652 billion. Together, these measures show better cash generation from regular operations and lighter factory-investment pressure in the quarter. Intel
Still, adjusted free cash flow was negative $8.419 billion. The major factor was $12.216 billion of net cash outflows related to co-investors, including $14.2 billion spent to buy Apollo's minority interest in Intel's Ireland facility. That is real cash leaving the balance sheet, even though it does not directly measure daily chip sales. Intel
Cash and short-term investments fell from $37.416 billion at the end of 2025 to $29.727 billion at the end of Q2 2026, while total debt rose from $46.585 billion to $50.537 billion. Removing the revaluation from the headline loss therefore does not remove all financial pressure. It simply asks the right question: operations are better, but how much capacity does Intel retain to fund the build-out? Intel
Q3 is the confirmation test
Intel forecasts Q3 revenue of $15.8 billion to $16.8 billion, GAAP gross margin of about 41% and diluted earnings per share of $0.31. These are company projections, not achieved results. Intel
The sensible conclusion is neither to dismiss the $11.033 billion net loss nor to treat adjusted profit as a complete answer. Intel's operations have clearly turned, but the durability of that change rests on three signals: whether margins hold while client-computing volume is weak, whether server revenue keeps rising through both price and volume, and whether Intel Foundry narrows losses through external customers. Cash flow and the balance sheet will show whether this operational improvement can survive the capital-intensive next stage.