

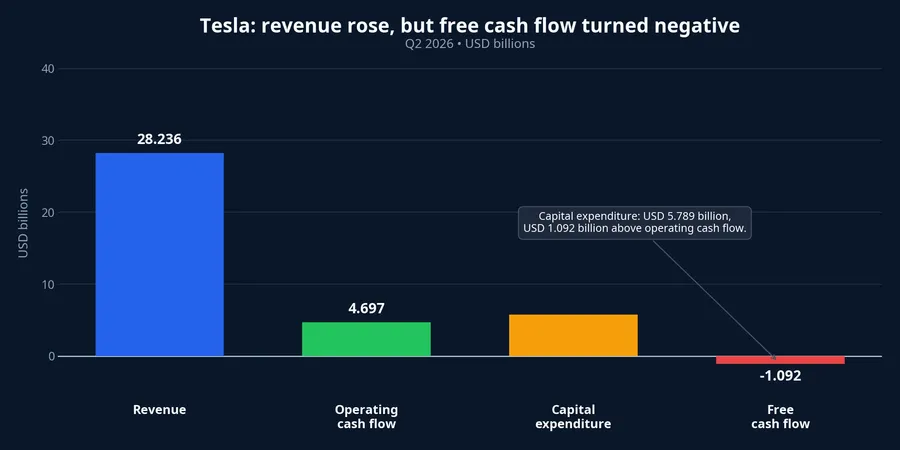
Tesla's latest quarter presents two numbers that can be misleading when read in isolation: revenue reached USD 28.236 billion, up 26% year on year, while free cash flow was negative USD 1.092 billion. Those metrics do not contradict each other. Revenue measures the goods and services a company sold; free cash flow shows what remains after the business has generated operating cash and invested in long-lived assets.Tesla
The key point in Q2 is not that Tesla failed to generate operating cash. It generated USD 4.697 billion from operations. The issue is that capital expenditure reached USD 5.789 billion, USD 1.092 billion more than operating cash flow. Until more evidence arrives, the sound reading is that Tesla is using its balance sheet to build new capacity faster than it can self-fund it within the quarter; the economic return on that capacity cannot be established from higher revenue alone.
The subtraction that matters more than the revenue headline
Put simply, free cash flow is operating cash flow minus capital expenditure. Think of a retailer that is collecting cash from sales while also building warehouses, buying equipment and opening new operating sites. The retailer may be selling well, yet have less than zero cash left after investment. For a growth company, that is why revenue cannot substitute for the cash-flow statement.
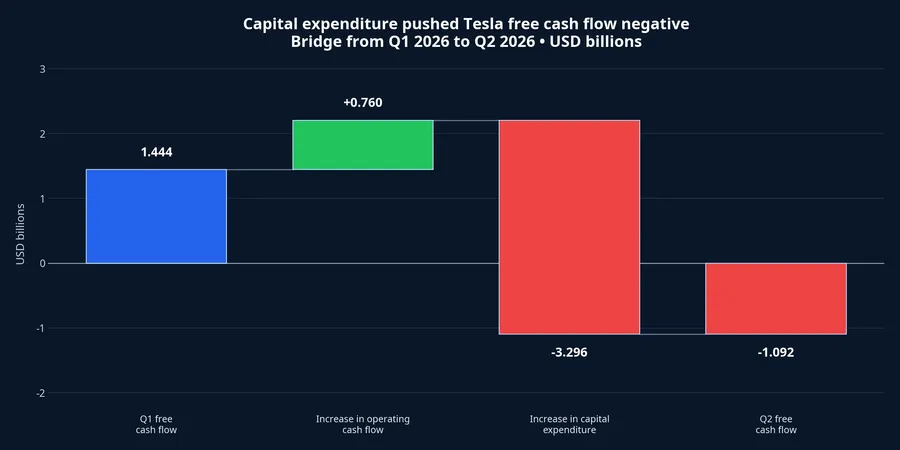
In Q1 2026, Tesla generated USD 3.937 billion of operating cash flow and spent USD 2.493 billion on capital expenditure, leaving positive free cash flow of USD 1.444 billion. In Q2, operating cash flow increased by USD 760 million. Capital expenditure, however, rose by USD 3.296 billion, far more than the operational improvement. Free cash flow therefore fell USD 2.536 billion in one quarter and turned negative.Tesla
The figures make the immediate explanation clear: the swing came from the investment pace, not a sudden loss of cash-generation ability in operations. Q2 operating cash flow increased 85% year on year, while capital expenditure increased 142%. Negative free cash flow can reflect investment ahead of future growth, but it becomes a positive thesis only if the assets ultimately generate commensurate revenue and profit.
Cash is moving into assets, and assets do not create cash immediately
Tesla does not break down its USD 5.789 billion of capital expenditure by individual project. It would therefore be unsupported to assign an exact amount to artificial intelligence, Cybercab, batteries or any particular factory. The report only confirms the broad direction of spending: on-site computing in Texas, manufacturing capacity, battery materials and assets supporting company-operated fleets.
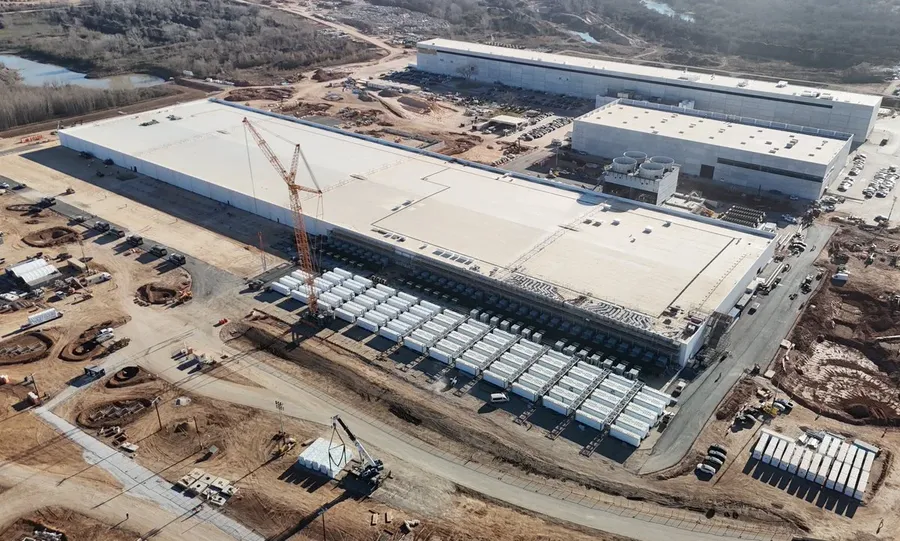
In Texas, Tesla said its on-site computing capacity more than doubled in the first half of 2026. Cybercab has begun production, while the Austin semiconductor factory remains in its early stages. The company is also increasing capacity for 4680 cells, cathode materials, lithium refining and LFP batteries, and identified battery-pack capacity as a near-term constraint on vehicle output growth.Tesla
These disclosures show assets being built for a strategy broader than vehicle sales. They do not mean profit has already been built. A computing centre becomes an economic asset only when workloads and the products using it scale. A new production line must also reach the necessary volume, utilisation and unit cost before investment turns into margin.
This is where investors should separate deployment signals from commercial proof. Tesla said Robotaxi was operating in seven major US metropolitan areas and that active FSD subscriptions reached 1.48 million, up 56% year on year. Those are signs that products have entered the market, but this quarter's report does not provide enough detail to allocate revenue, cost or cash flow precisely to each business line.Tesla

Rising revenue has not brought stronger profit quality
The revenue-cash-flow gap is not the only signal worth reading. Q2 operating income was USD 398 million, down 57% year on year. Operating margin declined from 4.1% to 1.4%, while research and development expense rose 49% to USD 2.371 billion. Net income attributable to common stockholders was USD 1.114 billion, down 5%.Tesla
It would be inaccurate to attribute the whole margin decline to capital expenditure. Capital expenditure initially sits on the balance sheet and is then recognised over time through depreciation; operating profit for the period also reflects operating expenses and revenue mix. Tesla cited lower average vehicle selling prices, lower regulatory-credit revenue, and higher artificial-intelligence and research costs. Higher revenue, therefore, does not yet demonstrate that each additional dollar of sales carries better profit quality.
Operating cash flow is not a fixed number either. In Q2, lower inventory added USD 592 million, while accounts payable and other liabilities added USD 1.94 billion. Prepaid expenses and other assets used USD 1.259 billion. Working capital can move with payment timing, inventory and deliveries, so investors should not assume that one quarter's operating cash generation repeats unchanged in the next.Tesla
Cash reserves and the next test
One quarter of negative free cash flow does not automatically signal a cash crisis. Tesla ended Q2 with USD 43.524 billion in cash, cash equivalents and short-term investments. That balance was down USD 1.219 billion from the end of Q1, but it remains a substantial buffer for the current investment programme.Tesla
The relevant test is not whether every investment generates cash immediately. It is whether operating cash flow catches up with capital expenditure as Cybercab, Robotaxi, FSD, batteries and new factory capacity move into use. If those assets produce high-margin revenue, utilisation, operating profit and operating cash flow should improve together in subsequent quarters.
The Q2 thesis is straightforward: Tesla is expanding sales, but did not self-fund the quarter's investment pace with operating cash generated in the same period. That does not prove the investment strategy has failed, nor does higher revenue confirm that it has succeeded. The subsequent reports should be read for the gap between operating cash flow and capital expenditure, operating margin, utilisation of the new assets, and the share of revenue that can be attributed to the new services.