
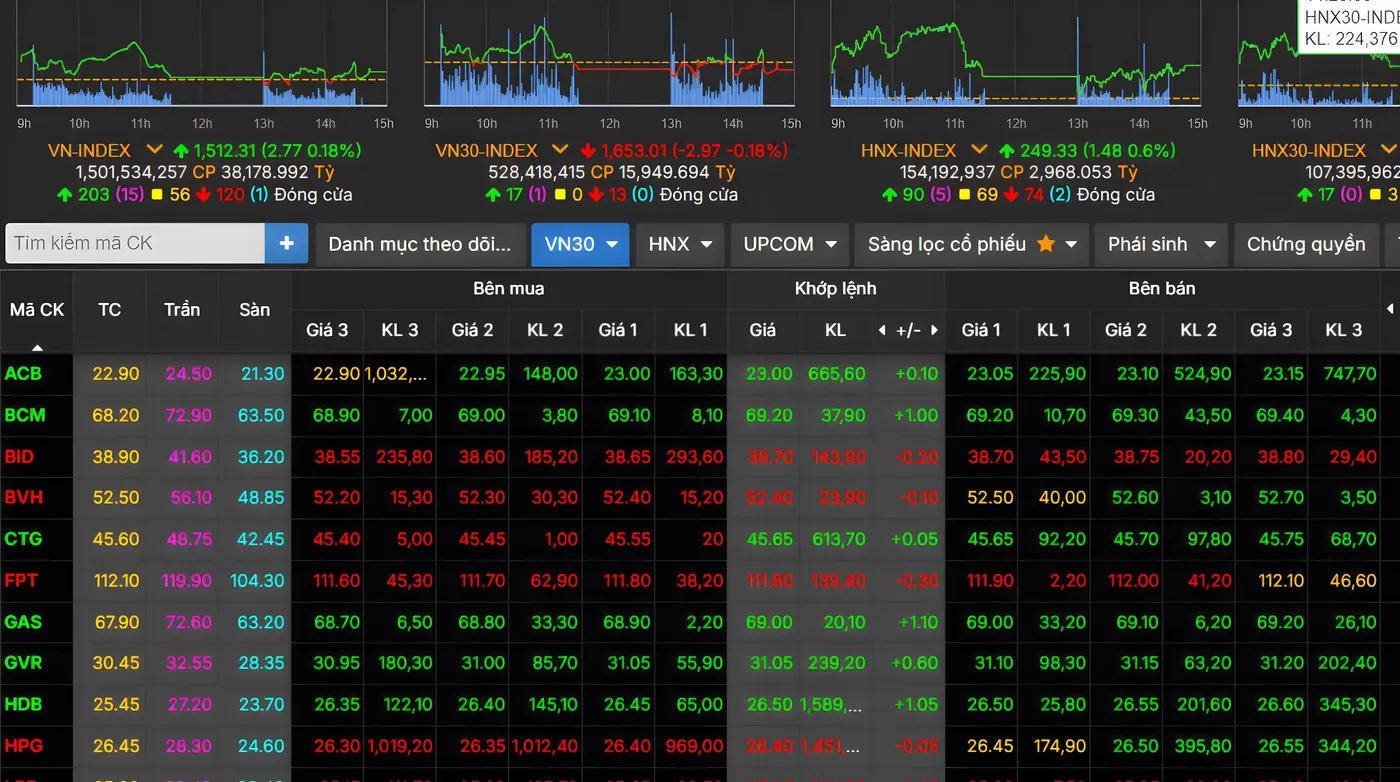

The VN-Index gained 30.85 points on July 23, while the board showed 203 gainers and 137 decliners. That is a genuine improvement in market breadth. At the same time, VIC alone contributed 19.15 points, or roughly 62.1% of the index gain. The two facts are not contradictory: the rebound reached more stocks, but the index points remained heavily concentrated in a large-cap name.
For newer investors, the easy mistake is to see a 1.85% index gain and assume their own portfolio has recovered by a similar amount. Think of the VN-Index as a market-wide snapshot, while breadth shows how many shares inside that snapshot are actually advancing. When a very large company rises sharply, the index can travel far beyond the average gain of the rest of the market.
The appropriate thesis for this session is therefore not that the market has already resumed an uptrend. It was a rebound with better breadth, but there is still insufficient evidence from trading flows to confirm a new base for the market.
Why two measures are better than one
Market breadth answers a plain question: are gainers or decliners in the majority? On July 23, gainers outnumbered decliners by 66 stocks. That matters because it differs from a green index session in which most shares are still falling, a situation where the headline index does not match many investors' experience.
But a stock count does not reveal every share's effect on the VN-Index. The index is more heavily affected by companies with larger market capitalizations. A near-6% move in a bellwether can therefore add more points than modest gains across dozens of smaller shares. Breadth and point contribution measure different things, so they should be read together rather than treated as competing indicators.
This distinction also prevents two opposite errors. A reader should not dismiss the session simply because VIC was dominant, since 203 advancing shares still describe a broader improvement than the previous selloff. Nor should the reader treat the gainers count as proof that every portfolio has become healthy again. The first measure describes participation; the second describes where the index's numerical lift came from.

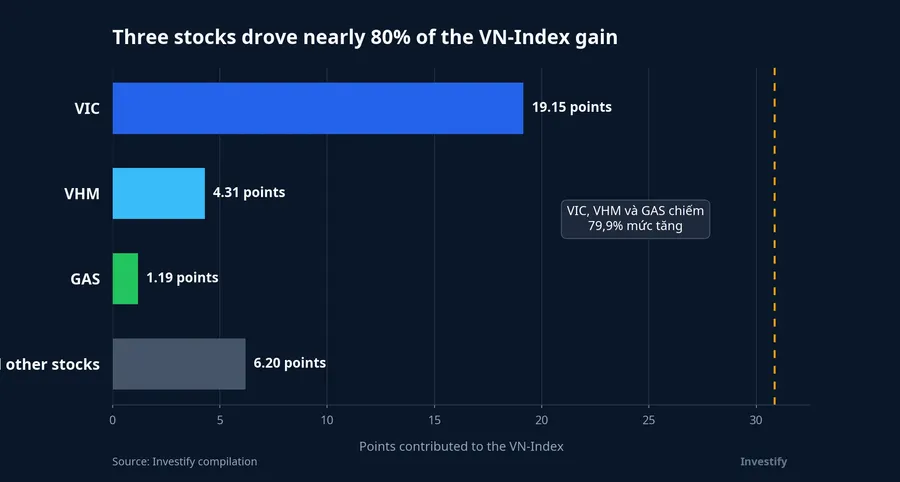
In this session, VIC rose 5.89% to VND 214,000 per share and added 19.15 points. VHM gained 4.02% and contributed 4.31 points, while GAS rose 3.73% and added 1.19 points. Together, the three shares contributed 24.65 points, nearly 79.9% of the VN-Index's 30.85-point advance. The numbers show that the green board was real, but the index impulse was not evenly distributed.
What the 62.1% figure tells us
With VIC responsible for more than 62% of the advance, the rest of the market collectively supplied only about 11.70 points after offsetting negative contributions. That is not inherently bearish. A rebound often starts with large caps, where large pools of capital can return quickly and influence sentiment most visibly.
What the evidence does not yet support is an extra causal leap: that VIC's move caused the whole market to strengthen. Other explanations fit the same session. Selling pressure may have eased after the prior day's decline, allowing many shares to rebound; alternatively, money may have concentrated first in large caps before spreading further. One session of data cannot reliably allocate the contribution of each mechanism.
The key next question is whether the leadership broadens. If banks, securities firms, manufacturers or consumer names add their own leaders, the index will have a wider foundation. If most points remain concentrated in VIC and a few other large caps, investors holding shares outside that group may not experience a recovery commensurate with the headline VN-Index.
The rebound did not come with more liquidity
On July 22, the VN-Index fell 62.03 points to 1,668.53. The next session recovered 30.85 points, a meaningful move but still only close to half of the prior day's loss.VTV That comparison does not mean the market must immediately reclaim every lost point. It simply places the rebound in its proper context after a sharp selloff.
Volume also belongs in the same picture. The rebound session recorded 864,451,379 shares, below the 904,523,604 shares traded during the decline. End-of-day turnover was VND 20,034 billion.Thời báo Tài chính Lower turnover does not automatically make a rising session a bad signal. Prices can rebound because sellers have become less aggressive, which is different from a large new pool of capital actively paying higher prices. Both can produce a green candle, but their implications for the following sessions are different.
Volume is most useful as confirmation, not as a verdict in isolation. A quiet rebound can become constructive if it is followed by sessions in which rising prices attract more participation. It becomes less persuasive if the index advances on shrinking activity while only a narrow group of large caps supplies the points. The question is not whether turnover must immediately break a record; it is whether demand is becoming more visible as the market asks investors to pay more.

That is why one lower-liquidity session should neither be used to declare that money has returned nor to prove that money is absent. The measured conclusion is that the current data do not yet distinguish the two explanations. The next sessions will show whether buyers are willing to absorb supply as prices rise.
How to read the July 24 session
Rather than trying to call a bottom from one candle, investors can track three sets of signals. First comes breadth. If gainers remain in the majority and deeply falling shares become fewer, the improvement will be more credible than a one-day reading. A healthy market does not require every sector to rise at once.
Second is the relationship between price and liquidity. An advancing index accompanied by higher volume would be stronger evidence that buyers are accepting higher prices. If the VN-Index rises while trading continues to contract, the interpretation that selling is merely pausing remains consistent with the data.
Third is a broader set of leaders. Banks and securities firms have outsized importance for both sentiment and overall trading activity, while manufacturing, consumer and materials names help test whether the advance is spreading to the rest of the market. This is not a shopping list. It is an observation framework for deciding whether the recovery belongs to the index or to a broad group of stocks.
The current conclusion should remain balanced: breadth improved on July 23, but VIC's 62.1% contribution and lower turnover than the selloff session mean a new uptrend has not been confirmed. The constructive case becomes stronger if breadth holds, trading improves and leadership expands. If those conditions do not appear, the more defensible reading is that the advance was a rebound after selling pressure, not a final verdict on the trend.