


VN-Index closed July 15 at 1,782.12 points, down 24.51 points or 1.36%. That is a move large enough to command attention, particularly because VIC and VHM were among the biggest drags on the index. But stopping with those two names risks missing the more important feature of the session: declining stocks on HOSE vastly outnumbered gainers. The day’s coverage also noted weaker liquidity as the index slipped below 1,800.VnEconomy
Put simply, the index tells us how many points the market lost; breadth tells us how many stocks were under pressure. The measures are related, but neither replaces the other. The central point here is that July 15 was not merely a story about a few index heavyweights: poor breadth indicates pressure reached many parts of the board, while 1,780 remains a level to test rather than proof that a bottom is in place.

Why index heavyweights move the benchmark so much
VN-Index is weighted by market capitalization. Think of it as a scale where the larger company carries the heavier weight. A modest move in a mega-cap can therefore affect the index more than a much steeper drop in a small stock. That is a normal property of the benchmark; it does not make the rest of the market irrelevant.
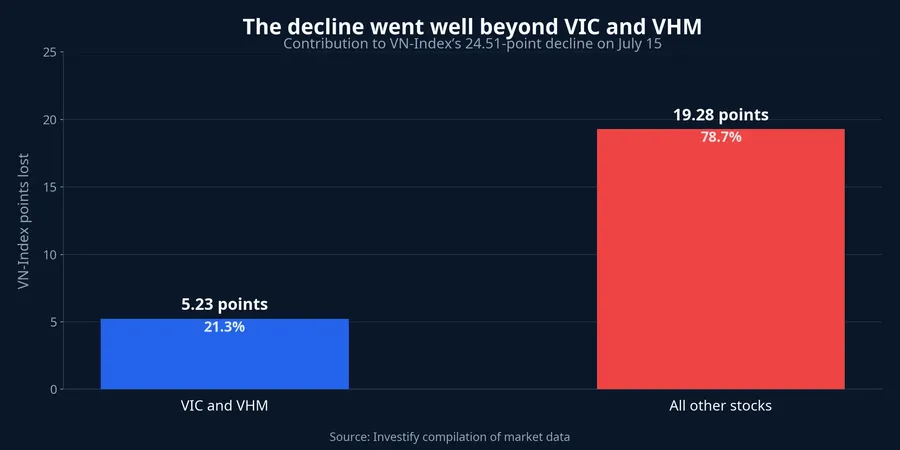
On July 15, VIC closed at VND 217,000, down 0.91%, yet it was estimated to remove about 3.02 VN-Index points. VHM fell 2.27% to VND 137,600 and took away roughly another 2.21 points. Together, the two stocks removed about 5.23 points, or 21.3% of VN-Index’s 24.51-point decline.
That 21.3% figure puts VIC and VHM in the right proportion. They were large enough to make the benchmark’s loss look harsher than the experience of some portfolios. Yet they cannot explain nearly four-fifths of the remaining decline. Saying that VN-Index fell “because of VIC and VHM” is therefore only partly true: it describes the index drag, but not the condition of the entire market.
Where did the rest of the decline come from?
The numbers offer a broader answer. FPT fell 3.56% to VND 67,800 and was estimated to subtract about 2.03 points. In banking, VPB, MBB, HDB and TCB each declined between 1.40% and 2.08%; their combined estimated drag was about 4.57 points. SSI, VJC and PNJ were also meaningful sources of pressure.
Those facts do not establish a single driver behind every sell order. Lower prices can coincide with profit-taking, portfolio rebalancing, reduced equity exposure or company-specific responses. What the evidence establishes more firmly is the scope: pressure was not confined to large-cap property names. It appeared in technology, banks, securities firms, aviation and retail as well.
This is the distinction between index impact and portfolio damage. An investor holding neither VIC nor VHM could still have experienced a meaningful down day through FPT, bank stocks or mid-cap holdings. Conversely, a portfolio tilted toward a few defensive names could have declined less than the benchmark. No single VN-Index number can substitute for checking the stocks actually held.
Market breadth tells the clearer story
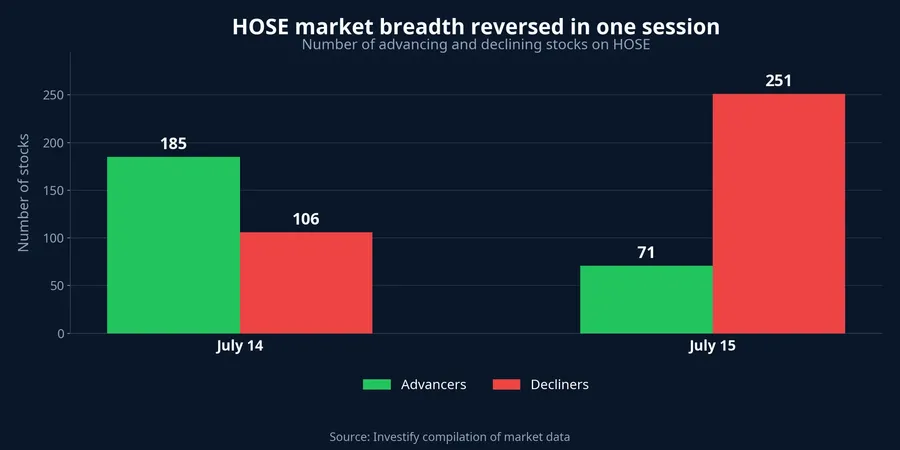
HOSE recorded 71 advancers, 251 decliners and 11 limit-down stocks on July 15. That works out to roughly 3.54 declining stocks for every gainer. It is not a pattern that two isolated heavyweight names could create across a board containing hundreds of companies.
The change from the previous session sharpens the signal. On July 14, HOSE had 185 advancers and 106 decliners. By July 15, advancers had fallen by more than 61%, while decliners had increased by nearly 137%. The advance-minus-decline balance moved from positive 79 to negative 180 stocks in a single session. That data shows sellers held the advantage across a broad swath of the market.
Still, “broad selling pressure” does not mean “a market-wide panic.” There were 71 gainers, while only 11 stocks closed at their daily downside limit. Precise language matters because it prevents readers from treating one poor-breadth session as a disorderly liquidation. The current data shows that declines intensified across a large part of the board; it does not by itself prove every investor was forced to sell at any price.
What higher volume on a down day can tell us
Trading volume exceeded 603 million shares, compared with nearly 562 million in the prior session, an increase of about 7.4%. When prices fall while volume rises, more shares are clearly changing hands at lower price levels. That often draws attention because the market needs to absorb more supply.
Volume alone, however, does not identify who initiated the trades. Every transaction has both a seller and a buyer, so it cannot prove that all activity was aggressive selling or, alternatively, bottom fishing. It becomes more useful alongside breadth: falling prices, dominant decliners and higher turnover form a combination that signals a weaker market condition. Calling it a sell-off would require stronger evidence from the scale of losses, limit-down counts and intraday recovery.
How to read the 1,780 level in the next session
VN-Index fell as low as 1,775.09 before closing back above 1,780. That suggests buying interest appeared at lower levels, but one successful defense is not enough to confirm balance. For newer investors, it is more useful to turn a round number into a set of observable signals than to treat it as a guaranteed support line.
First, watch breadth. If advancers and decliners move closer to balance, selling pressure may be narrowing even without a powerful index rebound. If VN-Index rises on a handful of large-cap names while red stocks still dominate, the recovery is narrow. A greener headline index would not mean that most portfolios have improved.
Next comes the behavior of large-cap groups. VIC, VHM and FPT together removed about 7.26 points on July 15. If they stop falling, the index may stabilize quickly, but that is only a necessary condition. A more durable improvement would also show up in banks, securities firms and mid-caps, where investors can see whether selling pressure is genuinely becoming less widespread.
Finally, assess the quality of trading around 1,780. A constructive outcome would be the index holding that area while breadth improves and volume does not surge alongside falling prices. A weaker outcome would see the index held up by a small number of heavyweights as declining and limit-down counts continue rising. The July 16 session will offer clearer evidence on which of those conditions is taking hold.
Conclusion: breadth matters before the headline index
July 15 showed that VIC and VHM can amplify VN-Index volatility, but they cannot obscure 251 declining stocks on HOSE. For new investors, that is why the benchmark should be read on two levels: heavyweight stocks explain the point move, while breadth describes the pressure a diversified portfolio may actually be absorbing.
The current thesis is neither that the market will certainly fall further nor that 1,780 has established a bottom. The better-supported conclusion is that the market has gone through a broadly weak session. That risk will ease more convincingly only if breadth moves toward balance and non-heavyweight groups improve as well. In the sessions ahead, those are more informative signals than the VN-Index’s color alone.