


Five large US banks reported better-than-expected second-quarter results on July 14. Yet an earnings beat is a starting point, not a verdict on earnings quality. The same increase can come from more lending and deposits, a busy trading desk, or a gain that is unlikely to recur. AP
Think of a bank as a shop with several counters. Lending and deposits usually provide a steadier stream of income. Trading, underwriting and M&A advice can be exceptionally busy for a quarter, but depend more on market activity and volatility. The central point is that both engines were working in Q2, but they should not be measured with the same yardstick.
Start with the source of profit
For a newer investor, three questions make a bank report easier to read. Is net interest income rising alongside loans and deposits? Is fee and trading income rising on durable client activity or on an unusually active market? And are provisions and net charge-offs deteriorating as the balance sheet expands?
No income stream is automatically superior. Trading and advisory franchises reflect genuine competitive strength at investment banks. But their repeatability needs to be separated from lending income and from one-off gains. That distinction is more useful than simply comparing an EPS beat or miss.
It also prevents a common reading error. A large trading gain can be evidence that a bank served clients well during a volatile period; it is not automatically evidence that household credit conditions are improving. Equally, loan growth looks more meaningful when it is accompanied by stable funding and credit indicators, rather than being viewed in isolation. A sound reading keeps these signals separate before bringing them together.

Goldman Sachs: a capital-markets quarter
Goldman Sachs provides the clearest example of a capital-markets-led result. Second-quarter net revenue was USD 20.34 billion, up 39% year on year, and net earnings were USD 6.63 billion. Its Banking & Markets division generated USD 15.52 billion, up 53%. Goldman Sachs
Within that division, equities trading revenue reached USD 7.42 billion, up 72%, while investment-banking fees were USD 3.40 billion, up 55%. Advisory fees were USD 1.38 billion, up 17%, so the result was supported by underwriting and deal advice as well as trading. Goldman Sachs
That does not make Goldman’s profit low quality. It reflects institutional relationships and execution capability built over years. It is, however, more sensitive to deal volumes, issuance and volatility. The available evidence does not establish that Q2’s trading backdrop will persist, so carrying that growth rate straight into future quarters would be too strong an inference.
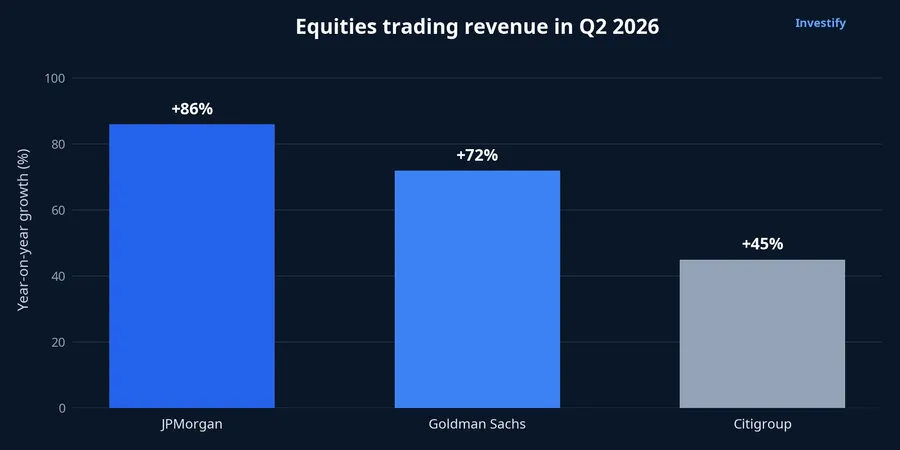
The chart also shows that equities trading was a sector-wide driver rather than a Goldman-only story. JPMorgan grew 86% year on year, Goldman Sachs 72%, and Citigroup 45%. Those rates describe a favourable quarter for market activity. On their own, they do not tell us which portion of profit will remain after trading normalises.
Wells Fargo: lending is easier to see
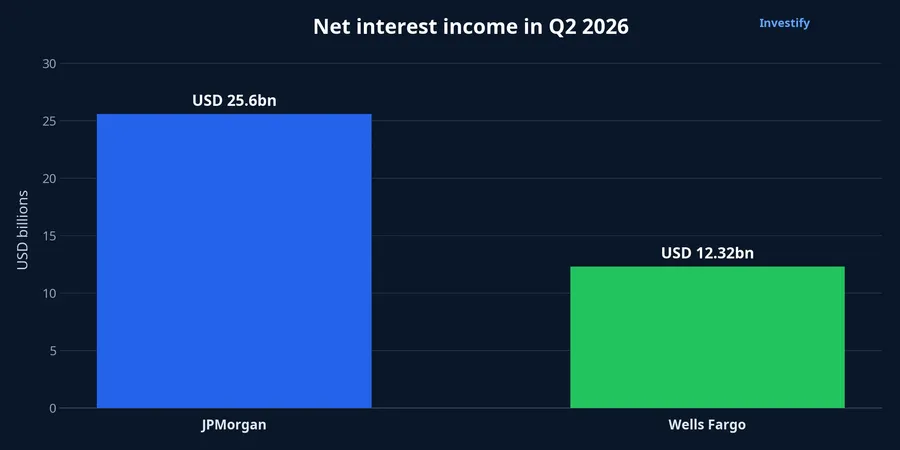
Wells Fargo sits at the other end of the comparison. It earned USD 6.41 billion in Q2, up 17%, on revenue of USD 22.62 billion, up 9%.More revealing for a bank reader, net interest income was USD 12.32 billion, up 5% year on year. Average loans rose 12% to USD 1,026.5 billion and average deposits rose 10% to USD 1,465.6 billion. Wells Fargo
Those figures offer a more direct signal about credit demand and balance-sheet expansion. In this reading, the scale of net interest income deserves priority over short-term moves in market-facing businesses.
Credit quality remains essential context. Wells Fargo’s provision for credit losses fell 9% to USD 914 million, while net charge-offs fell 11% to USD 883 million. Wells Fargo One quarter cannot prove that risk has disappeared, but the current figures do not show an obvious deterioration accompanying loan growth.
That is why Wells Fargo’s report gives a different kind of information from Goldman’s. It does not mean that one business model is safer in every market environment. It means the report gives a reader more direct evidence about the lending engine: the volume of loans, the funding base, the interest income generated and the credit cost attached to that growth.

JPMorgan, Bank of America and Citigroup: two engines at once
JPMorgan illustrates why headline net income needs a second look. AP reported USD 16.9 billion in Q2 profit after significant items were excluded. AP Its core franchise was still strong: equities trading revenue was approximately USD 6.03 billion, up 86%, and net interest income was USD 25.6 billion. Zacks TradingView
Bank of America likewise has two meaningful engines: capital-market activity and lending. The evidence does not support assigning the increase in banks with this model to one cause alone, because both parts of the business matter.
Citigroup also improved across several lines. Net income was USD 5.83 billion, up 45%, on revenue of USD 24.77 billion, up 14%. Equities trading revenue rose 45% to USD 2.30 billion, while bank-wide net interest income rose 13% and average loans grew 10% to USD 785 billion. Citigroup Its provision for credit losses fell 12% to USD 2.52 billion, though the absolute level still deserves to be read alongside loan growth in later quarters. Citigroup
The comparison should not be treated as a league table. Goldman’s heavier exposure to capital markets is appropriate to its franchise, while Wells Fargo’s lending-led mix speaks to a different customer base and operating model. JPMorgan, Bank of America and Citigroup demonstrate why a large universal bank can contain both profiles at once. The investor’s task is to identify which source is changing, then ask whether the accompanying risk measures support that change.
A compact framework for the next report
The evidence supports a clear conclusion: Q2 was strong for both market-facing and lending activity at major US banks. Goldman Sachs benefited most visibly from capital markets. Wells Fargo offered the clearest lending signal through net interest income, loans, deposits and credit metrics. JPMorgan, Bank of America and Citigroup sit between those poles, so their results should be read by income line rather than given one common label.
For the next reporting cycle, the useful question is not merely which bank beats expectations again. Put four lines next to each other: net interest income, trading and fee revenue, loan or deposit growth, and credit provisions. If core income keeps expanding while credit measures remain stable, the case for durable earnings strengthens. If growth is concentrated in trading or a one-off gain, the result can still be good, but it should be understood as a more variable source of profit.