


An 11.1% gain in VN-Index during Q2 2026 is the kind of headline that makes new investors assume money has returned across the board. That reading feels intuitive because the index is the easiest thing to see on the screen and the easiest thing to repeat after a strong quarter. But if you stop there, you miss the more important layer underneath: the part of the market that reflects day-to-day retail trading activity actually became thinner, not deeper.Tin nhanh Chứng khoán
Put simply, Q2 offered a useful lesson in market reading. The index can rally hard while the quality of underlying money flow fails to keep up. When that happens, the sense that “the whole market is healthy again” is often an illusion created by a handful of large-cap names and a handful of very large transactions.
A rising index does not automatically mean stronger money flow
According to Tin nhanh Chứng khoán, total trading value on HOSE reached roughly VND 1.377 quadrillion in Q2, down about 24% from approximately VND 1.802 quadrillion in Q1.Tin nhanh Chứng khoán That detail alone should remind investors that a stronger index does not necessarily mean stronger participation. If total turnover is lower, the safer default is to ask the reverse question: who is lifting the index, and is the rest of the market actually moving with it?
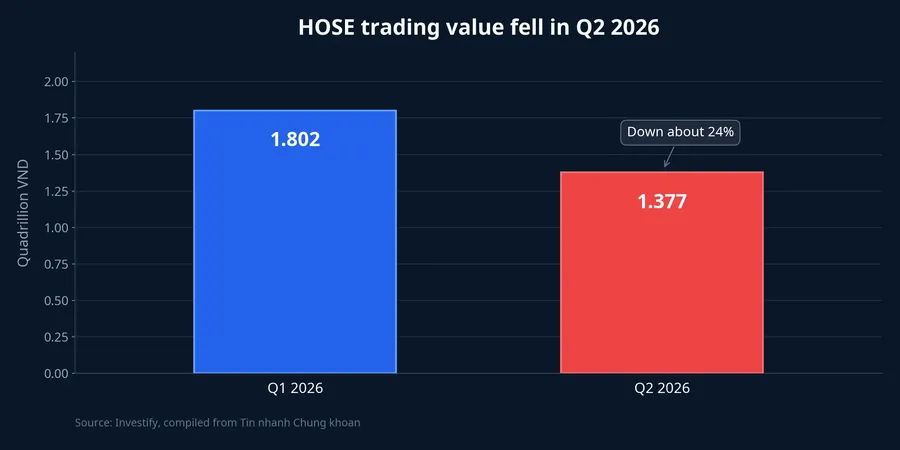
Investify market data shows VN-Index rising from 1,674.49 points at the end of Q1 to 1,860.01 points at the end of Q2, a gain of about 11.1%. That is a real move, and not a small one. But an index is a weighted average. When a sufficiently large cluster of heavyweight stocks rallies, it can push the whole benchmark higher even if the broader list of stocks does not feel stronger to most investors.
This is where newer investors often misread the tape. A green index over several weeks makes it tempting to assume the odds of picking the right stock have improved as well. That may not be true. If the advance rests heavily on a narrow set of leaders, investors who arrive late are using a very broad signal to make decisions at the single-stock level.
Matched orders are the layer worth watching most closely
One simple way to think about it is this: total turnover is the headline, while matched orders are closer to the market’s pulse. They capture what investors do on the screen in real time, placing and adjusting orders as prices move. When matched orders weaken, the actively traded public layer of the market is not as healthy as the index makes it look.
Tin nhanh Chứng khoán estimated that matched-order value on HOSE fell about 31% in Q2, from roughly VND 1.620 quadrillion to around VND 1.125 quadrillion.Tin nhanh Chứng khoán The important point is not just that matched orders fell, but that they fell faster than total trading value. In other words, the most visible layer of daily market participation shrank more quickly than the surface-level turnover figure for the exchange.
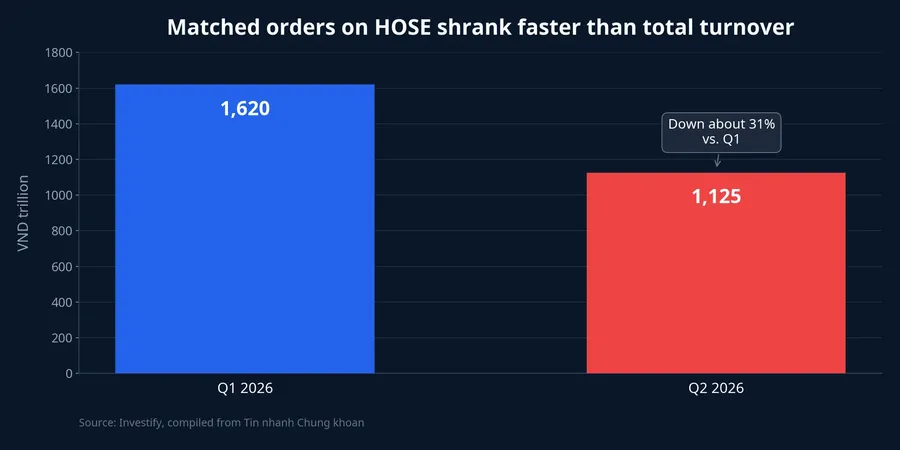
For retail investors, that distinction matters. If total turnover is down 24% but matched orders are down 31%, the market is sending a clear message: the day-to-day buying and selling activity of the crowd is less active than it was in the prior quarter. In that setting, treating a higher index as proof that “money is back” is too quick.
Block deals can distort the feel of liquidity
The next layer to separate is block trading. Block deals are not inherently negative, and they are not automatically a warning sign. They are simply a different kind of transaction, often tied to large negotiated transfers, ownership restructuring, or trades between identified counterparties. The problem is that they do not reflect broad retail sentiment in the same way matched orders do.
In Q2, block deals accounted for 18.3% of total trading value on HOSE, up from 10.1% in Q1. On HNX, the ratio rose from 6.2% to 14.4%. On UPCoM, it jumped from 10.1% to 30.5%.Tin nhanh Chứng khoán When that share expands so sharply, total turnover starts to look healthier from a distance than the average investor’s actual experience on the screen.
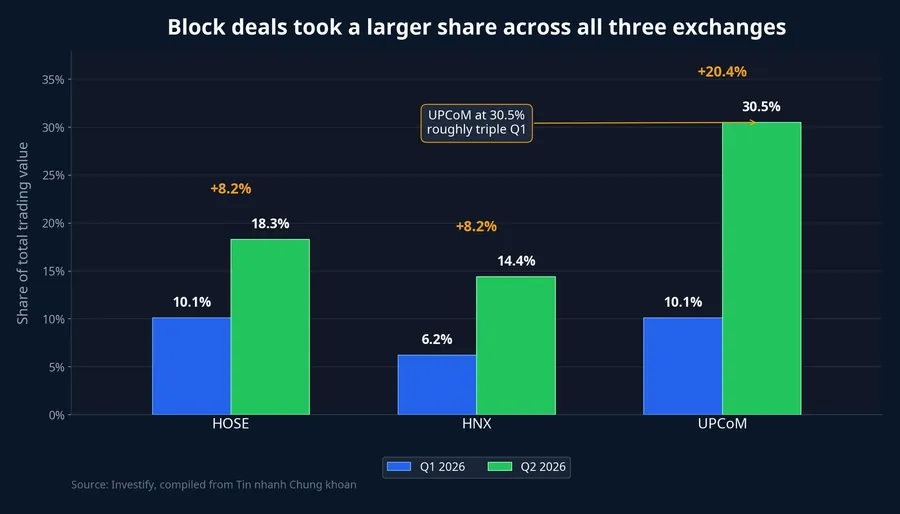
That changes how the market should be read. A single very large negotiated trade can lift daily or quarterly turnover, but that does not mean public buying interest is broadening. If investors do not separate this layer out, they can easily mistake a large number for a broad-based market. Those are not the same thing.
Why the index still climbed
If active liquidity was thinner, why did the index still rally so strongly? The clearest answer supported by the Q2 data is concentration in a cluster of stocks large enough to move the benchmark. Tin nhanh Chứng khoán reported that VIC rose 63% in Q2, VHM 53%, VRE 14.6%, and VPL 7.7%. Combined trading value in those four names reached about VND 176,720 billion, equal to 12.8% of total HOSE trading value for the quarter.Tin nhanh Chứng khoán
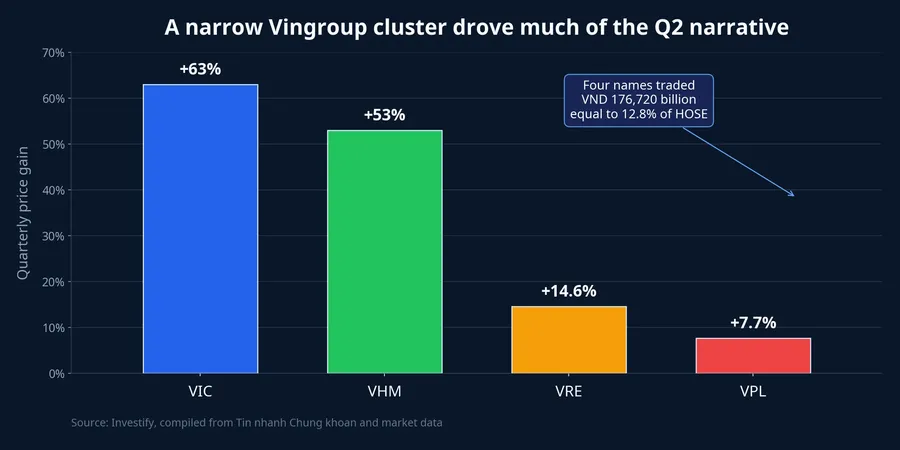
Twelve-point-eight percent concentrated in just four tickers is a large share. It suggests money did not disappear from the market, but it flowed more heavily into a cluster with enough market-cap weight to shape the index. So saying “the market was strong” in Q2 is not entirely wrong. The more accurate statement is that the index was strong because a narrow leadership group was strong, while opportunity did not broaden proportionally across the whole market.
Discipline also matters when talking about cause. The data clearly shows that the Vingroup cluster rose sharply and captured a large share of trading value in Q2. That is enough to say the index was pulled higher by a concentrated group of names. It is not enough to assign a single definitive cause to the entire move. For a retail-facing blog post, the more important point is the shape of the flow: it was concentrated, not evenly distributed.
The question retail investors should ask in an up quarter
Instead of asking, “How much did VN-Index rise?” a more useful question is, “Which layer of money is actually expanding?” The index shows the surface. To understand whether an advance is broad and durable, investors need at least three additional checks.
The first is matched orders. If the index is rising while matched-order value falls sharply, that advance deserves a more cautious read. It does not automatically mean the market is weak, but it does say that active participation from the crowd is not widening in step with the benchmark.
The second is the share of block deals. When negotiated trades take a larger slice of total turnover, the headline turnover number stops being a clean proxy for broad sentiment. Retail investors should treat that headline as raw data, then ask how much of it came from screen-driven activity and how much came from large bilateral transfers.
The third is breadth. A healthier advance usually comes with more sectors improving together, a less lopsided balance between advancers and decliners, and liquidity that is not trapped in just a few large-cap stocks. If those three layers do not line up, a green index can still be real, but the feeling that “everything now has a chance” is usually false.
Conclusion: Q2 invalidated the simple reading
The conclusion should be straightforward. Q2 2026 did not disprove the strength of VN-Index. An 11.1% gain is unambiguous. What the quarter did disprove was the simple reading that a higher index means the whole market is healthy again and money has returned on a broad front.
For retail investors, the more sensible default after Q2 is to treat the index as the surface layer and run market judgment through three filters: matched orders, block-deal share, and breadth. When those signals are not moving in sync, enthusiasm tends to arrive before the underlying flow does. In markets, getting early because you misread the structure of money is rarely cheap.