


A glance at the closing board on May 26 and most investors would scroll right past: VN-Index ended at 1,884.18 points, down just 1.85 points or -0.10%. A figure practically frozen in place. For anyone who uses the headline index as their sole barometer, this looked like a sleepy session with nothing worth discussing.
It was, in reality, one of the week's strongest episodes of sector divergence. The flat aggregate was not the result of nothing happening — it was the result of two opposing capital flows of roughly equal size cancelling each other out. The real story only emerges one layer deeper.
A 10+ Percentage-Point Gap Within a Single Session
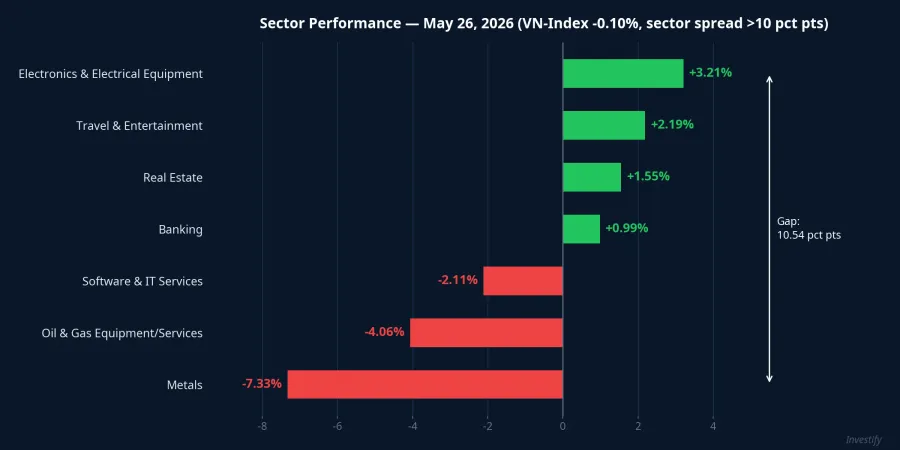
The May 26 sector picture is far more striking when the two extremes are placed side by side. Electronics and electrical equipment gained 3.21%, travel and entertainment rose 2.19%, real estate added 1.55%, and banking edged up 0.99%. Simultaneously, metals fell 7.33%, oil and gas equipment and services dropped 4.06%, and software and IT services declined 2.11%.
The gap between the strongest gainer and the deepest loser exceeded 10 percentage points within a single trading session. That is not the signature of a quiet market — it is the signature of capital moving fast, switching from one group to another in roughly offsetting volumes.
The Common Thread: Oil Repricing on Iran Deal Hopes
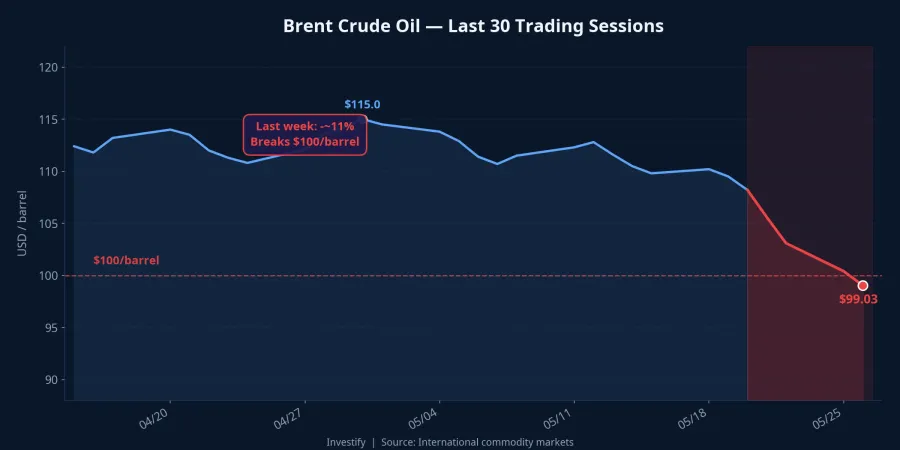
Reading this session requires the weekly context. Brent crude fell approximately 11% over the past week, dropping from around $111/barrel to $99.03 and breaking below the $100 mark for the first time in a month.CNBC The catalyst: growing expectations that the US and Iran are closing in on an agreement to end the conflict and reopen the Strait of Hormuz.
This is a meaningful move. From the near-$120 peak when hostilities were at their most intense, prices have come off substantially. Markets began pricing a "gradually cheaper oil" scenario, and that scenario split the Vietnamese stock market into two distinct halves on May 26.
Two Different Declines, Two Different Mechanisms
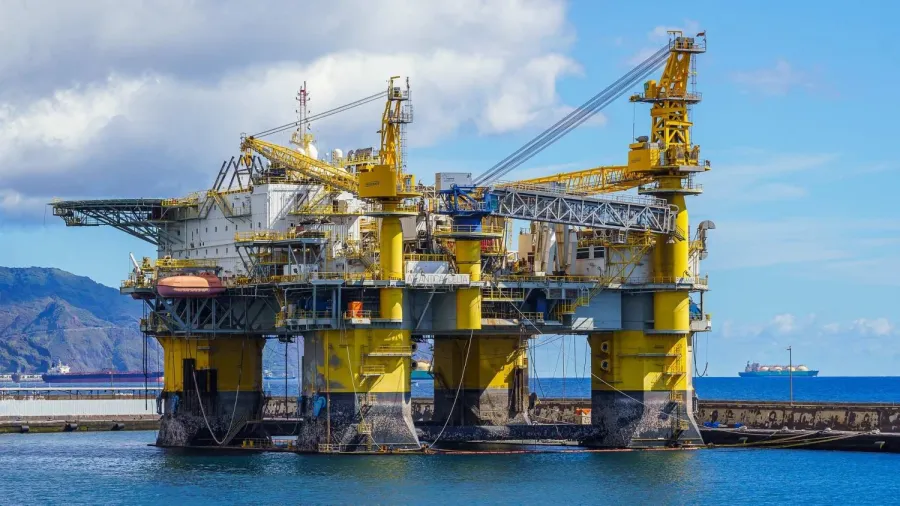
The oil and gas equipment and services sector's 4.06% drop follows a direct, straightforward logic: revenue in this group is tied to oil prices and to capital spending by energy majors on exploration and production. When the market prices in cheaper oil, forward earnings expectations in this group fall immediately, and investors sell ahead of the numbers. This is the intuitive reaction.
The metals sector's 7.33% decline requires a more careful reading. In theory, cheaper energy actually reduces input costs for steelmakers, which should support margins rather than hurt them. So why did metals fall harder than oil services?
The more plausible explanation lies in risk sentiment. During the weeks of intense Iran conflict, the entire commodity-cyclical basket — including metals — had been priced with an embedded geopolitical risk premium. When credible peace signals arrived, that premium deflated, and capital rotated out of commodity cyclicals broadly. Metals were sold alongside oil stocks, even though the underlying economic logic differed.
One additional nuance worth noting on the 7.33% figure: of the 45 stocks in the metals sector, only 12 actually fell on May 26, while 9 rose and 24 were unchanged. The group's near-7% decline was concentrated in a handful of large-cap names that drive the sector index. Even sector averages can mask a reality where most individual stocks barely moved.
A Telling Detail: Oil Stocks Fell Even Though Oil Rose That Day
Here is a detail easy to miss. Brent crude did not fall on May 26 — it actually rose 1.83% to close at $99.03. If investors were reacting purely to that day's oil price, energy stocks should have been in the green. They were not.
This reveals how the market is actually operating: it is not trading on individual daily data points, but on the prevailing narrative built over the week. What is being priced is the scenario of a completed Iran deal and sustained lower oil costs — not a single session's fractional move. The practical implication for investors in energy names is clear: stock prices in the coming days will respond far more to developments in the US-Iran talks than to daily oil price fluctuations.
Where the Money Went
On the other side of this reallocation sit the domestically-oriented sectors. Electronics and electrical equipment, tourism, real estate, and banking share a common trait: energy costs are an input line on the income statement, not the revenue driver. As oil prices fall, expected costs for these groups compress and margins widen. In a session where capital was fleeing commodity cyclicals, these sectors were the natural destination: both benefiting from cheaper energy and carrying less geopolitical exposure.
Even within the winning groups, however, sector averages do not tell the full story. Real estate rose 1.55% in aggregate, but internally the divergence was pronounced: PDR surged 6.94% while VHM fell a sharp 3.09%, bucking its own sector's direction. In the electrical and construction segment, VNE climbed 6.67%. The pattern repeats at every level: the headline index obscures sectors, sector averages obscure individual stocks.
Signals to Watch for May 27
"VN-Index -0.10%, quiet session" is an incomplete reading. The more accurate picture: May 26 was a strong thematic portfolio reallocation driven by the cheap-oil narrative, in which capital exited commodity cyclicals and flowed into domestic sectors that benefit from lower energy costs. The two opposing flows were roughly matched in size, creating the illusion that nothing happened on the scoreboard.
The practical consequence is tangible: investors holding commodity-cyclical positions and those holding domestic-oriented positions experienced entirely different days, regardless of what the index screen showed.
The durability of this rotation hinges on one specific variable: the trajectory of US-Iran talks. Secretary of State Marco Rubio of the US State Department stated there were "good signals" toward an agreement, but the two sides remain at odds over Iran's enriched uranium stockpile and the question of tolls on the Strait of Hormuz.CNBC These two sticking points could reverse the entire trade if negotiations collapse.
The signal to watch on May 27 is not the VN-Index level — it is how oil prices react to any new developments from the negotiating table, and whether capital continues to favor domestic-oriented sectors or rotates back into commodity cyclicals if geopolitical risk gets repriced upward.