


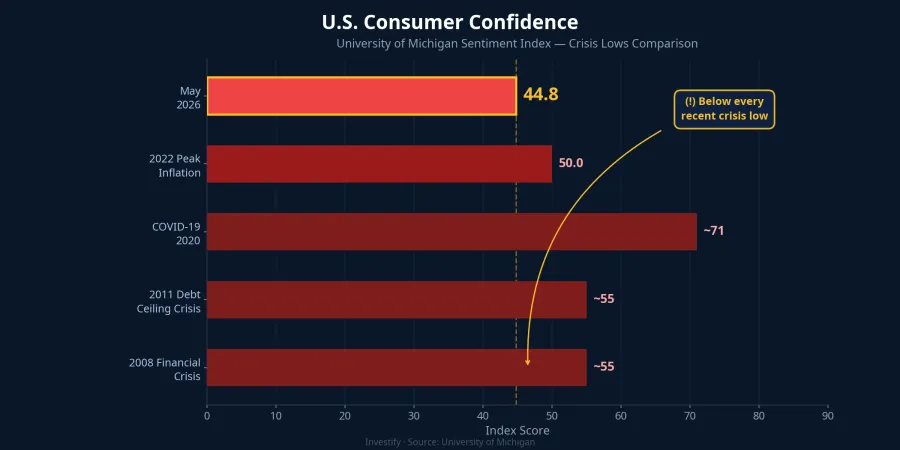
The week ending May 22, 2026 produced two numbers that seem impossible to coexist. The Dow Jones closed at a new all-time high of 50,579.70 points, while the S&P 500 extended its winning streak to eight consecutive weeks, the longest such run since late 2023.Yahoo Finance At the same time, the University of Michigan released its May consumer sentiment reading at 44.8, the lowest level since the survey began tracking data in 1952. That reading falls below the Covid-2020 trough (~71) and the 2008 financial crisis floor (~55).InvestingLive
These two numbers are not actually contradictory. They measure two different cross-sections of the same society, and understanding how they diverge — now at a historically extreme gap — is the real analytical frame investors need in this environment.
One Economy, Two Cross-Sections
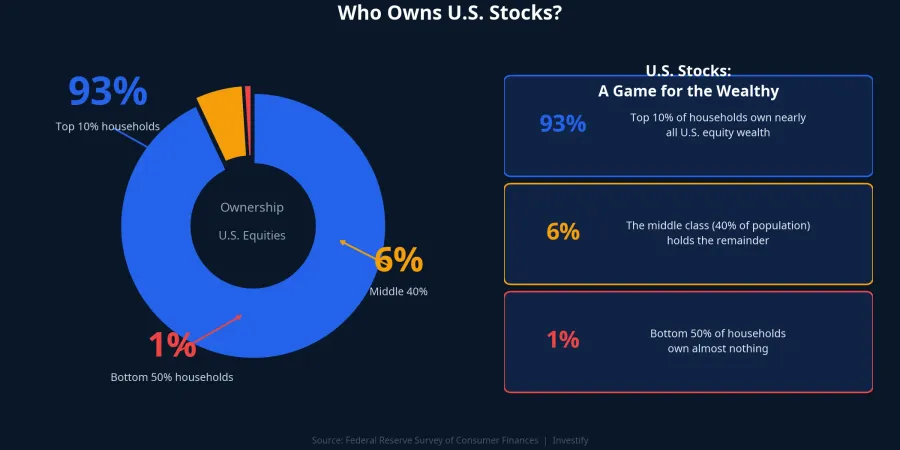
The S&P 500 measures the price of financial assets. And financial assets in the United States are distributed extraordinarily narrowly. According to data from the Federal Reserve's Survey of Consumer Finances, the wealthiest 10% of households own approximately 93% of all stock and mutual fund value in the country.Federal Reserve The middle tier — the next 40% of the population — shares just 6%. The bottom half of American households, 50% by income, holds roughly 1%. Eight consecutive weeks of S&P 500 gains flow directly into the balance sheets of that narrow group, not into the lived experience of everyone else.
The Michigan index operates differently. It measures how individual households perceive their own economic conditions: gas prices, grocery bills, borrowing costs, and their ability to buy a home. The survey sample is distributed across the population by headcount, not by wealth. In the May report, 57% of respondents identified prices as the single largest factor affecting their personal finances.Scotsman Guide That is the voice of the majority, not the top decile.
When the Wealthy Drive Aggregate Demand
According to Moody's Analytics research, the top 10% of U.S. earners accounted for 49.2% of total consumer spending in Q2 2025, the highest share since tracking began in 1989. By comparison, that figure stood at roughly 36% in the 1990s and approximately 43% in 2020.Fox Business It is worth noting that this figure remains contested in academic circles regarding estimation methodology, but even critics of the method agree the direction of the trend is real.
The market implication is significant. When equities rise, the wealth of the top 10% rises, and they spend more. That feedback loop is large enough to keep aggregate consumer spending stable even as middle and lower-income households pull back in response to higher prices. A single GDP growth figure can therefore mask deepening income polarization underneath. A stock market record and a broad sense of economic hardship are not in conflict. They are two sides of the same K-shaped mechanism.

What the Rally Looks Like on the Inside
This week's market high was not broad-based. The sectors leading the S&P 500 during the week ending May 22 were Healthcare and Utilities.The Motley Fool These are classic defensive plays: stable cash flows, consistent dividends, and limited exposure to the economic cycle. Meanwhile, technology and consumer discretionary — the groups that typically lead during genuine risk-on rallies — moved sideways or underperformed.
One reading of this rotation: capital is quietly repositioning toward lower-risk holdings even while the headline index prints new highs. This does not necessarily signal an imminent reversal, since Healthcare and Utilities can outperform for reasons specific to their own earnings dynamics. But if the pattern persists in coming weeks, the winning streak will be increasingly concentrated in a narrow slice of the market. The quality of the advance deserves more scrutiny than the headline level suggests.
Historical Precedent: How Long Does Divergence Last
There are two relevant historical episodes when the S&P 500 continued climbing while the Michigan index was declining sharply.
In 2010-2011, the debt ceiling shock and the United States' first-ever credit rating downgrade dragged consumer confidence lower. The S&P 500 maintained momentum beforehand, but several months after the divergence became extreme, the market experienced a significant correction in Q3 2011.
In 2022, Michigan bottomed at 50.0 in June amid 40-year-high inflation and aggressive Fed tightening.Scotsman Guide The S&P 500 had already begun weakening early that year, and by October 2022 had fallen roughly 27% from its peak.
The common pattern: markets typically do not respond immediately to divergence. The historical lag between when sentiment-market divergence becomes extreme and when a meaningful correction materializes has been in the range of two to five months. Each episode had its own specific causes, so the directional lesson transfers; the magnitude and timing do not. The current divergence has different drivers: Strait of Hormuz tensions pushing up gasoline prices, and tariffs lifting one-year inflation expectations in the May Michigan report to 4.8% and long-run expectations to 3.9%.InvestingLive
Three Signals to Watch
Three variables will reveal whether the divergence is easing or approaching a breaking point.
June Michigan inflation expectations. The one-year reading of 4.8% sits in territory where the Fed is unlikely to cut rates. If the June report pushes above 5%, the rate-cut support that has underpinned equity valuations weakens significantly.
Spending data from upper-income households. If high-end retail, international travel, and premium services begin slowing, the K mechanism is closing from the top: a more meaningful early warning than aggregate consumer sentiment numbers.
Breadth of the S&P 500 rally. If Healthcare and Utilities continue to lead in coming weeks, the winning streak is narrowing. If technology and consumer discretionary reclaim leadership, the market is pricing in a self-correcting economic recovery. These two scenarios carry very different implications for the next leg.
What This Means for Vietnamese Portfolios
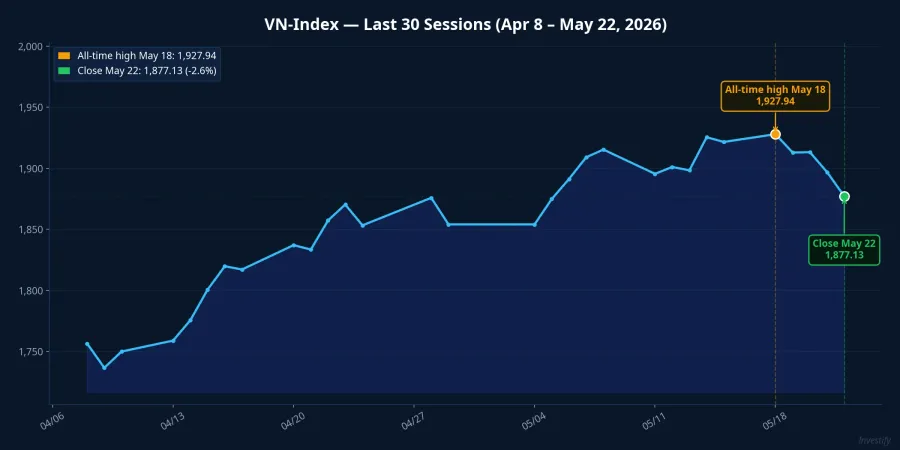
The VN-Index closed the week at 1,877.13, pulling back approximately 2.6% from its all-time high of 1,927.94 earlier in the week. Reading this correction in global context requires an important caveat: the S&P 500 is still in the green, but its internal dynamics are sending defensive signals, not signals of broad-based euphoria.
Using the S&P 500 as a general proxy for U.S. economic health is a misleading read in a period of extreme K-shaped divergence. The index reflects the assets of a narrow group whose returns are supported by rate-cut expectations and large-cap earnings growth. The rest of the economy — what the Michigan index is actually measuring — is telling a different story.
The VN-Index pullback from 1,927 to 1,877 has not reversed the long-term uptrend. In a globally bifurcated environment like this, the common approach is to maintain portfolio allocations while being more cautious about short-term volatility, rather than adding to positions. The U.S. market's rotation toward defensive sectors is a capital flow pattern that tends to replicate across other markets when global risk appetite shifts down a notch.
The question worth tracking in coming weeks is not whether the Dow Jones will print another record. It is whether the June Michigan report shows any recovery in consumer confidence, and whether the S&P 500 rally broadens back into technology and consumer discretionary. Those two data points will determine whether today's K-shaped divergence is gradually closing or still building pressure.