


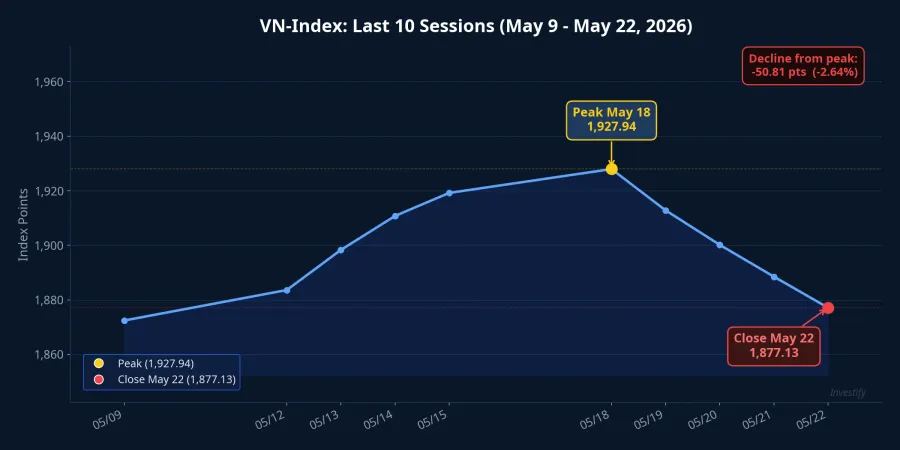
VN-Index closed at a record high of 1,927.94 on Monday, May 18, surpassing every previous closing level. By Friday, the index had retreated to 1,877.13, a decline of 50.81 points or 2.64%. But that number is not the most important thing to understand about this week. The real question is: did Monday's peak have broad-based support, and what was actually happening beneath the surface of the index?
The 1,927 Peak Was Carried by a Single Sector
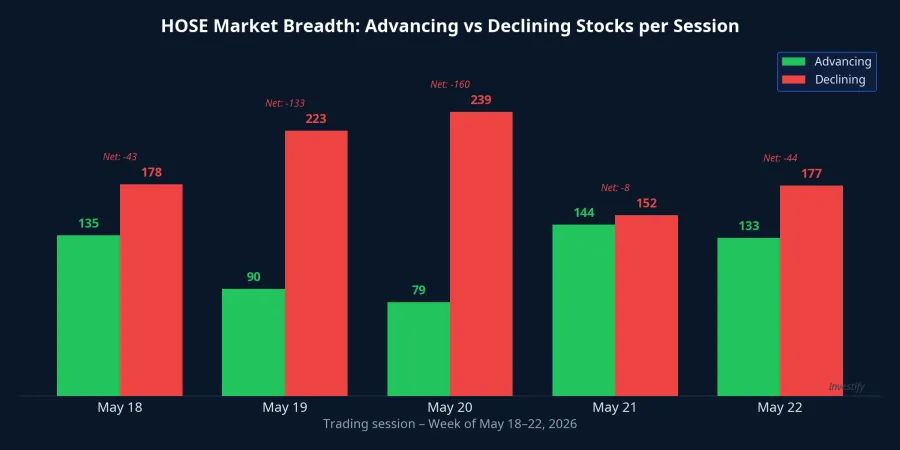
Looking at market breadth on the peak session (May 18) reveals an uncomfortable truth. Of all stocks traded on HOSE that day, 135 advanced versus 178 declined. The index made history while most individual portfolios were in the red.CafeF The push came almost entirely from the oil and gas sector: GAS closed at VND 93,000 (+4.03%), BSR at VND 33,450 (+5.35%), PLX at VND 45,150 (+6.99%), PVD at VND 35,800 (+6.23%), and PVT at VND 25,300 (+5.20%). Four of those five names nearly hit the daily ceiling. Brent crude was simultaneously reaching a near-term high of USD 112.10 per barrel.
When an index sets a record while most of its components are falling, that is a structural warning. The upward push is being supplied by a handful of large-cap names, not a genuine broad advance. And when that push is driven by a commodity sector prone to rapid reversals — like oil — the probability of a quick turn is elevated.
Tuesday: Oil Stocks Fell Before Brent Did
The reversal came the very next session, and it unfolded in a revealing sequence. Brent crude on May 19 slipped just 0.73% to USD 111.28, barely moving. Yet Vietnamese oil stocks collapsed in unison: GAS -6.99%, BSR -6.88%, PVD -6.98%, PLX -6.98%, PVT -6.92%. BSR's trading volume surged to over 31 million shares, roughly 1.5 times the peak-day volume. VN-Index fell 15.01 points to 1,912.93.CafeF
The selloff cannot be attributed to Brent, which had barely moved at that point. The more plausible explanation is a combination of profit-taking by speculative money that entered on Monday, amplified by forced selling from leveraged accounts. When a sector rallies 5–7% in a single session on the back of an external factor that can reverse at any moment, profit-taking tends to hit before the underlying commodity actually turns.
Breadth Keeps Deteriorating: Index Moves Sideways, But Most Stocks Were Down
The two mid-week sessions (May 20 and 21) provided further evidence for the poor-quality-peak thesis. On May 20, VN-Index was nearly flat at 1,913.23. But breadth was severe: 79 stocks advanced versus 239 declined, an approximate 3-to-1 ratio. By May 21, the index slipped to 1,896.89 (-0.85%), breaking below 1,900 for the first time that week.
This pattern deserves attention. When an index falls just 0.85% while three out of four stocks are in the red, the index is being propped up by a small number of very large capitalization names. Individual investors, whose portfolios are typically not weighted like the index, were experiencing losses considerably larger than 0.85%. Adding fuel to the decline, Brent crude began a genuine slide: down 5.63% to USD 105.02 on May 20, then a further 2.32% to USD 102.58 on May 21. A USD 6.30 drop in two sessions cut into earnings expectations for the energy sector and spread pressure to the rest of the market.
Friday, May 22: Heavy Volume, Biggest Foreign Sell in the Week
Friday delivered the sharpest single-day drop. VN-Index lost 19.76 points (-1.04%) to close at 1,877.13.Nguoi Dua Tin HOSE turnover reached approximately VND 22,029 billion with 854 million shares matched, a high reading for the week. Foreign investors sold a net of over VND 3,200 billion on Friday alone, with one banking stock absorbing nearly VND 1,500 billion in net selling in a single session.CafeF
For the week as a whole, VN-Index fell 44.47 points (-2.31%) versus the prior Friday. Measured from the May 18 peak close, the decline was 50.81 points over four sessions. Each individual day's move looked modest in isolation; together they formed a steady, uninterrupted pullback.
VND 6,281 Billion in Net Selling: Rotation, Not Exit
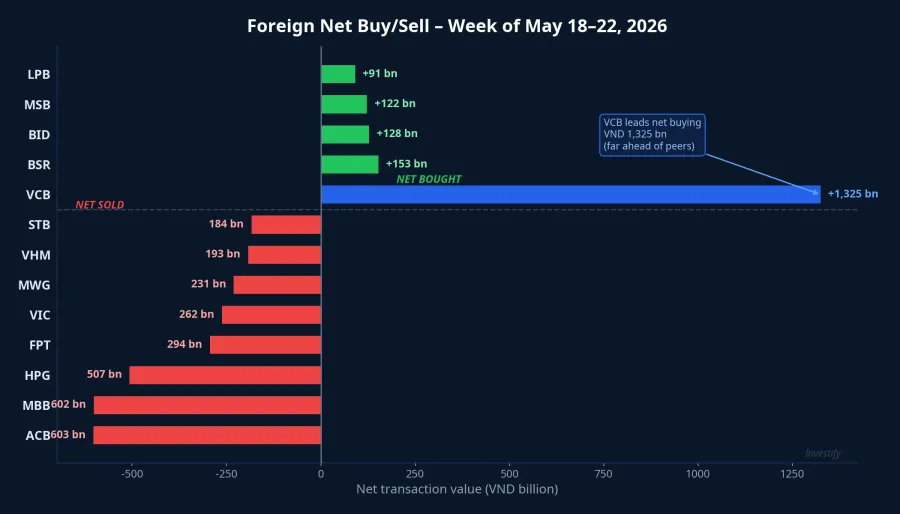
This is the most important detail for anyone tracking capital flows. Over the full week, foreigners net sold VND 6,281 billion on HOSE, net sold VND 130 billion on HNX, and net bought VND 34 billion on UPCoM. That is roughly 70% larger than the approximately VND 3,700 billion in net foreign outflows recorded the week before.CafeF
More revealing than the headline total is where the selling was concentrated. The most-sold names were private commercial banks and large-cap stocks: ACB approximately VND 603 billion, MBB approximately VND 602 billion, HPG approximately VND 507 billion, FPT approximately VND 294 billion, VIC approximately VND 262 billion, MWG approximately VND 231 billion, VHM approximately VND 193 billion, and STB approximately VND 184 billion. On the buy side, Vietcombank (VCB) led by a wide margin with approximately VND 1,325 billion in net purchases. BSR attracted VND 153 billion, BID VND 128 billion, MSB VND 122 billion, and LPB VND 91 billion.
Reading this structure together, this does not look like a broad withdrawal from Vietnam equities. Foreigners appear to be reallocating within the banking sector: trimming private mid-sized banks (ACB, MBB, STB, TCB) and accumulating state-owned banks (VCB and BID). The selling in HPG, FPT, VIC, and VHM likely reflects a broader reduction in large-cap exposure rather than a specific sector call.
One piece of evidence in support of this reading: FPT faced nearly VND 300 billion in net foreign selling yet closed the week at VND 75,100, up 3% from the prior Friday. Domestic buyers absorbed the entire foreign outflow and pushed the price higher. Not every stock with net foreign selling declined. That is a sign of a market with domestic liquidity deep enough to absorb external selling pressure.
The 1,877 Level and Three Signals to Watch Before May 25
Technically, VN-Index's close of 1,877.13 sits below the 20-day moving average near 1,891, though still well above the 50-day average near 1,785. The RSI(14) is around 53, a neutral reading with no oversold condition. Near-term support is 1,860–1,870 (the low of Friday's candle), with stronger support at 1,850. Resistance sits at 1,900–1,905, with the all-time peak at 1,927 as the key level above.
Three signals are worth monitoring in parallel heading into Monday's session.
First, Brent crude's behavior over the weekend. If Brent continues toward the USD 100 level, selling pressure on the energy sector will persist. A recovery above USD 105 would give the 1,860–1,870 support zone a better chance of holding.
Second, foreign investor behavior in private-sector banks. If selling in ACB and MBB continues alongside buying in VCB, the rotation signal remains intact. If foreigners pause selling across both groups, direct downward pressure on the market eases.
Third, turnover on Monday's open. Friday's session matched 854 million shares, an elevated reading. If May 25 sustains above 800 million shares, the market is likely in active distribution. If volume drops below 600 million, selling pressure has cooled and the 1,860 zone may prove to be an accumulation range rather than a way station lower.
The core question for next week remains open: is 1,877 a consolidation point before another test of the 1,927 peak, or the midpoint of a deeper correction cycle? Current evidence does not favor a clear directional conclusion. Monday's session and how money behaves at the 1,860 level will provide the first meaningful data point.