
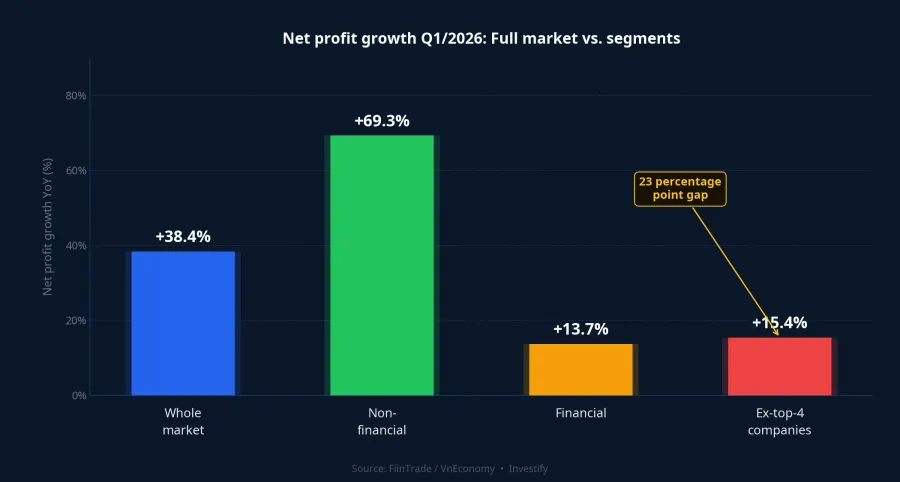
Looking at the headline 38.4% growth in net profit after tax across Vietnam's listed market in Q1/2026, most retail investors would read this as confirmation of a broadly positive earnings season. The reading is natural enough: 803 companies have reported,VnEconomy non-financial listed companies surged 69.3%, and financials grew a steady 13.7%.VnEconomy Against that backdrop, the VN-Index hit an all-time high of 1,927.94 points on May 18 and closed May 20 at 1,913.23. The surface picture looks strong.
But FiinTrade included a detail worth pausing on in the same May 20 report: if you strip out the four leading contributors — VHM, BSR, HPG, and VPL — the net profit growth of the rest of the market drops to just 15.4%.VnEconomy Both figures are accurate, and both are necessary. The problem is that they answer fundamentally different questions, and reading the wrong one leads to misaligned expectations.
Four Companies, Four Different Profit Mechanisms
What stands out from Q1 earnings is not that these four companies reported strong profits. What matters is the nature of each profit source, and whether that nature is repeatable.
Vinhomes (VHM) contributed approximately VND 27 trillion in net profit,VnEconomy largely from handing over units at Ocean City, Royal Island, and Green Paradise in Q1. This is a quirk of real estate accounting: revenue is recognized at actual handover, not spread evenly across quarters. VHM still has a substantial pipeline of undelivered inventory, but the pace of recognition depends on construction progress and handover schedules. It is not a run-rate that multiplies cleanly across four quarters.
BSR (Binh Son Refining and Petrochemical) contributed approximately VND 8.9 trillionVnEconomy on the back of a widening refining margin as Brent crude held near its highs. The refining margin — the spread between refined product prices and crude input costs — is a pure commodity cycle variable. When geopolitics and regional fuel-supply dynamics are supportive, margins expand. When conditions shift, BSR's earnings compress accordingly.
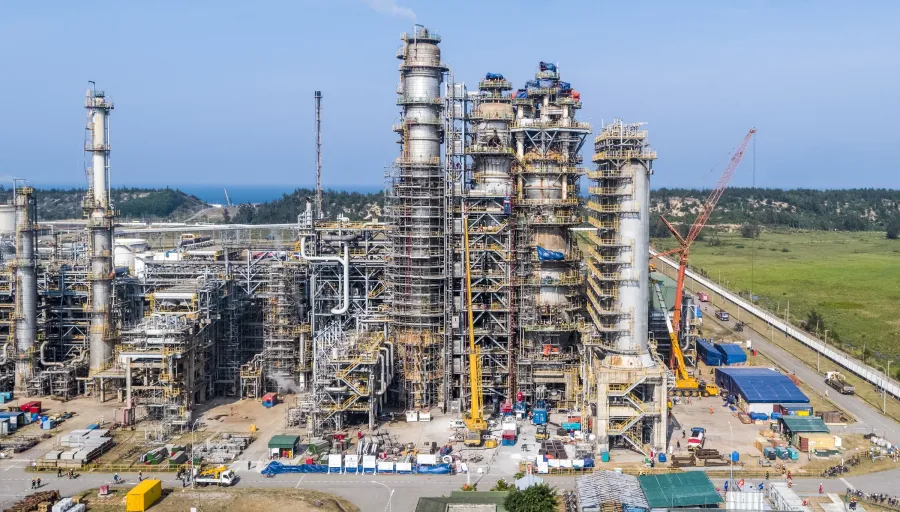
HPG (Hoa Phat) and VPL (Vinpearl) share an important commonality. Per VnEconomy's compiled data, the portion that pushed both companies into the market's top four came from non-core activity: HPG from a real estate project transfer in Hung Yen, and VPL from a project transfer in Ho Chi Minh City.VnEconomy To be clear: both HPG (steel) and VPL (hospitality) saw their core businesses grow in Q1. But the contribution that elevated them to the top four was one-time income from asset transfers, which by definition does not recur.
The takeaway from all four: three of the four drivers are not structurally recurring on a quarterly basis. VHM's handover cycle depends on project-by-project construction timelines. BSR's refining margin depends on global commodity conditions. HPG's and VPL's asset transfer gains are definitionally non-repeating. Only HPG's core steel operations (volumes and margins) represent more operationally stable growth. Steel margins have already returned to the top of the recovery cycle.
Sector Breakdown: Structural Growth vs. Cyclical Tailwinds
Zooming out to the sector level, Q1/2026 shows a clear divergence between genuine base-rate growth and gains driven by cyclical factors or favorable comparison bases.
The top performers share a common thread. Oil and gas, up more than 1,000% YoY, is the most extreme case of low-base effects combined with wide refining margins. It is not a signal of operational breakthrough. Real estate rose roughly 180% YoY, but strip out VHM and NVL and the sector was broadly flat. Steel rose approximately 142.5% YoY on expanded volumes and improving margins in the recovery cycle.
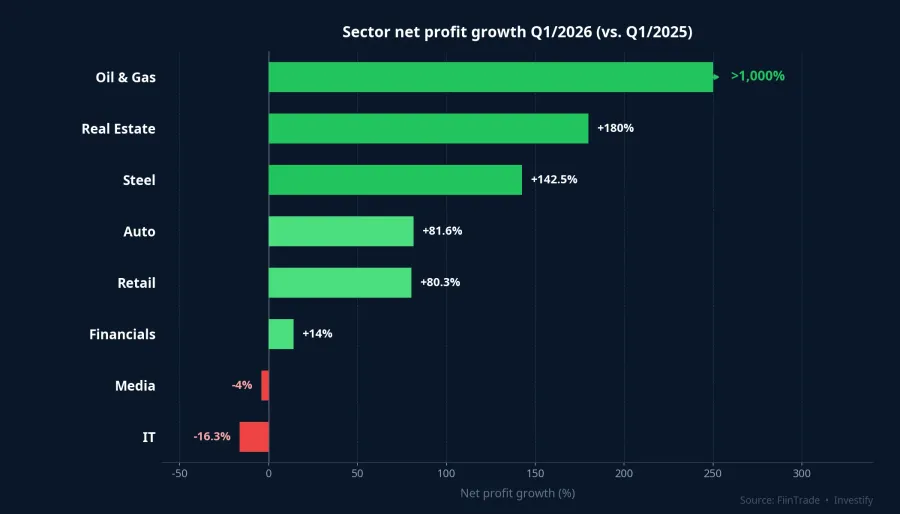
The middle tier includes auto (up 81.6% YoY) and retail (up 80.3% YoY). Both sectors benefited from a genuine demand recovery combined with a weaker comparison base from 2025. Financials grew 13–15% YoY, stable but unremarkable relative to the broader market.
The most notable signal sits at the bottom. Information technology fell approximately 16.3% YoY, and media declined roughly 4%. These two sectors were widely viewed as structurally driven growth engines in Vietnam's market from 2023 to 2025, when digital transformation spending and digital advertising budgets were expanding. This negative growth in a sector previously viewed as a structural growth engine deserves serious analytical attention, not a quick read in an aggregated report.

38.4% and 15.4%: Two Correct Numbers, Two Different Questions
The 23 percentage point gap between 38.4% and 15.4% is not a data accuracy issue. Both numbers are right. The issue is that they answer different questions, and each is relevant to a different type of investment decision.
The 38.4% answers: "how much did total market net profit grow?" This is the directly relevant figure if you hold ETF VN30 or index funds, because your portfolio already carries high weights in these leading companies. The 15.4% answers: "how much did the average company outside the top-cap group grow?" This is the more relevant baseline if you are building a single-stock portfolio outside the large-cap leaders.
The practical implication: the 38.4% aggregate is not a signal to buy the broad market indiscriminately. When four companies account for nearly half of the absolute profit increase, investing in the index effectively places a heavy bet that this group sustains its momentum. At least three of the four drivers are cyclical or one-time in nature.
For single-stock positions outside the top-cap leaders, the analytical read requires a three-layer decomposition: how much of net profit comes from core operating activity, how much comes from real estate handover timing, and how much comes from non-recurring items like asset transfers or temporarily favorable commodity prices.
Q2/2026: The Real Confirmation Test
Q2/2026 will be a more informative earnings season than Q1. If VHM's handover pace slows, if BSR's refining margin compresses as oil prices ease, and if neither HPG nor VPL has additional asset transfers to book, the aggregate market growth rate could converge toward the 15.4% of the rest of the market, even without any deterioration in the majority of listed companies.
The upside scenario: if the 15.4% cohort accelerates in Q2 on the back of domestic consumption recovery or export order growth, aggregate growth can still be positive. The difference is that the growth would be distributed more broadly, rather than concentrated in four names.
Two signals worth monitoring over the coming weeks: VHM's handover pipeline from EGMS disclosures, and BSR's refining margin trajectory as global oil prices remain volatile. These two variables will determine whether the 38.4% headline is repeatable, or whether the aggregate converges back toward the underlying base rate.