
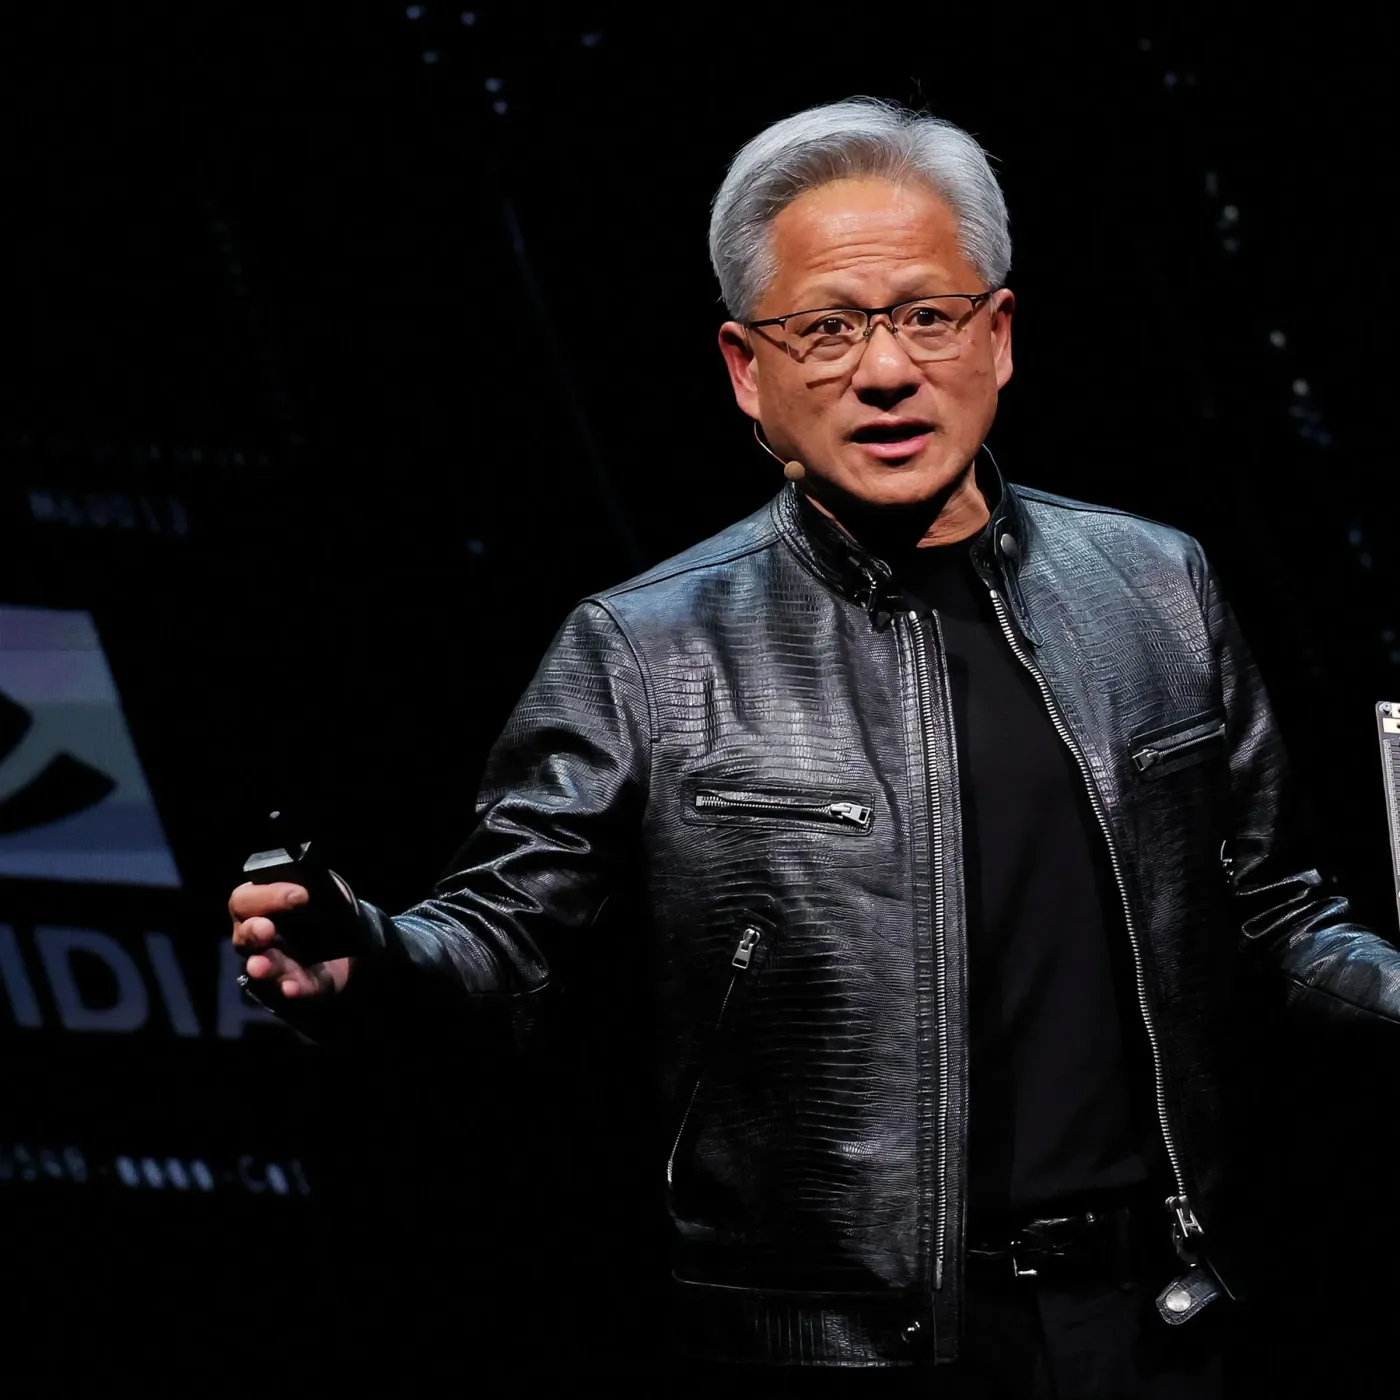

Cerebras (CBRS) hit the Nasdaq on May 14 with a nearly 70% surge in its debut session, then shed roughly 10% the very next day, closing at $279.72 after touching $311.07 the day before.Yahoo Finance It was the largest Nasdaq IPO since Uber listed in 2019.CNBC That two-day whipsaw revived a familiar question: is the 2026 AI boom simply a replay of the dot-com bubble?
When you place both eras side by side using hard data, the answer is cleaner than gut feeling suggests. The 2026 AI market differs from 2000 on two critical dimensions, but resembles it on a third — and that third dimension is the one worth worrying about.
Valuation: The Gap Is Wider Than You Think
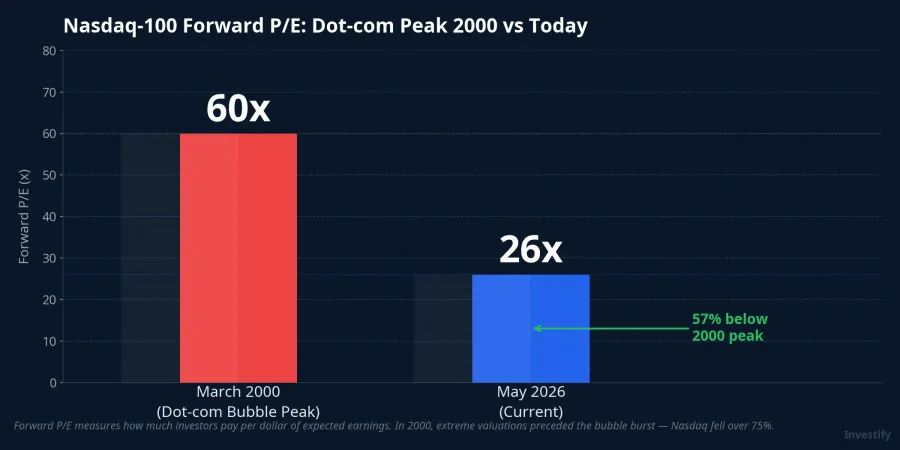
Think of forward P/E as the price you pay for each dollar of earnings a company is expected to generate. The higher the P/E, the more faith — and risk — is priced in.
At the March 2000 peak, the Nasdaq-100 traded at a forward P/E of roughly 60x, meaning investors were willing to pay $60 for every $1 of expected future earnings.IntuitionLabs At that point, 86% of recently listed tech companies had no profit, and most lacked meaningful revenue. Buying a stock was largely buying a pure promise.
In 2026, the Nasdaq-100's forward P/E sits at roughly 26x. Still above the long-run historical average, but less than half the 2000 peak.IntuitionLabs That does not mean today's market is cheap. It means today's market is expensive relative to history, but not irrationally expensive the way 2000 was.
Real Profits: The Core Difference from 2000
The deeper distinction is not in the P/E multiple itself but in the earnings quality behind it.
In 2000, approximately 74% of listed internet companies had negative operating cash flow, according to research by Professor Jay Ritter at the University of Florida analyzing internet IPOs of that era.IntuitionLabs The standard business model was: raise capital, burn cash for user growth, raise more capital. When market enthusiasm for funding dried up, the model collapsed completely.
In 2026, the leading AI companies operate in exactly the opposite way. Nvidia closed fiscal year 2026 with revenue of $215.9 billion and net income of $120.1 billion, carrying a gross margin above 70% and a net profit margin above 55%.NVIDIA Newsroom These are not projected figures. They are audited numbers filed in an official 10-K report in February 2026.
More telling: AI infrastructure spending is being funded by internally generated profit, not by debt. Combined capital expenditure from Amazon, Google, Microsoft, and Meta for 2026 is estimated at roughly $725 billion, up 77% year over year, with more than $130 billion in the first quarter alone.IntuitionLabs All four companies generate operating cash flows large enough to cover their capex without net borrowing. This is structurally different from the dot-com era, when telecom carriers and internet service providers took on massive debt to build backbone infrastructure, then defaulted when revenue fell short of interest payments.
Concentration Risk: The Part That Actually Looks Like 2000
If the two sections above offer some reassurance, this one does not.
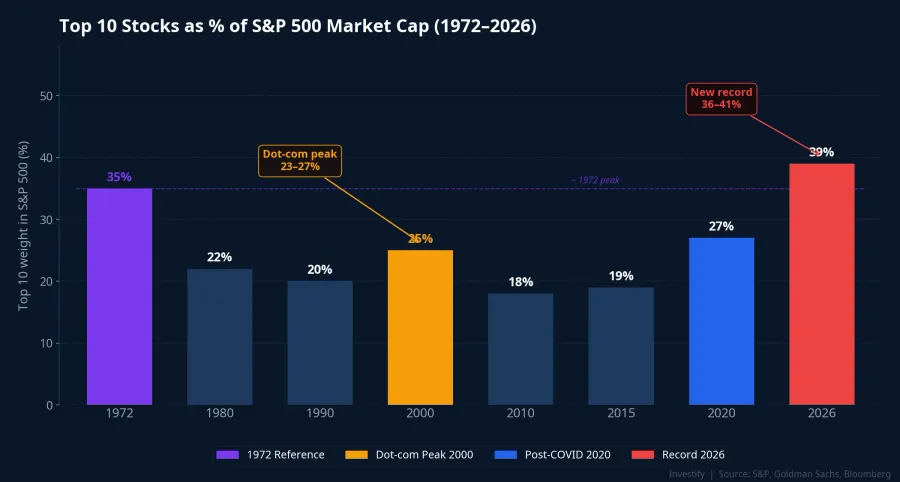
The top 10 stocks in the S&P 500 now account for roughly 36–41% of the index's total market cap.RBC Wealth Management At the dot-com peak in 2000, the equivalent figure was 23–27%. Today's concentration does not merely match the 2000 high — it exceeds it, reaching the highest level recorded since at least 1972.
Put simply: if you buy an S&P 500 index fund today, roughly four cents out of every ten you invest are controlled by fewer than ten companies. Even professional fund managers are watching this closely.
There is one mitigating factor: those same top 10 stocks contribute roughly 31% of the index's total earnings, meaning their outsized weight in the index has some earnings backing. In 2000, the top 10 commanded a large share of market cap without a proportionate share of profits. That is a meaningful distinction, but it does not eliminate concentration risk.
The 15-Year Breakeven Lesson from Dot-com
Many people remember the 2000 crash as dramatic but brief. The long-run lesson is more sobering.
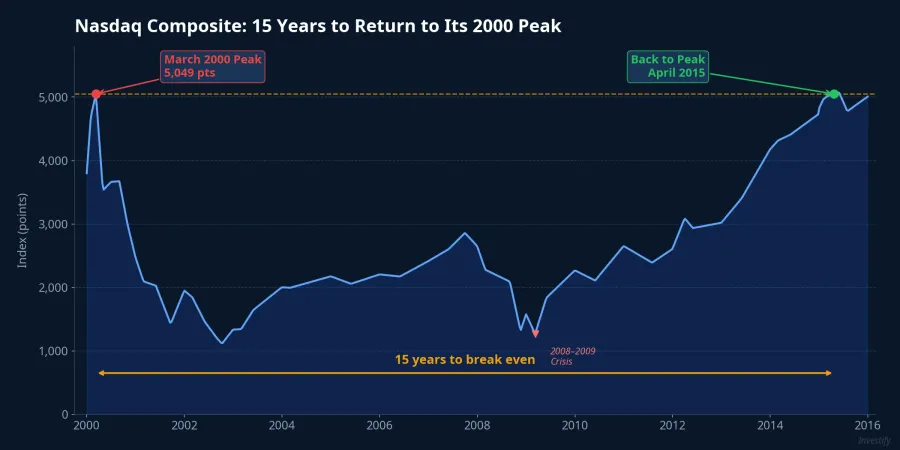
After peaking in March 2000, the Nasdaq took 15 years, until April 2015, to reach its prior high again.Wikipedia Anyone who bought at the peak had to wait until 2015 just to break even, before accounting for inflation eroding their purchasing power in the interim.
More important still: while the index recovered in 15 years, many individual tech stocks never came back. Cisco is the textbook example. It was one of the largest companies of that era, with genuine revenue and genuine profit, yet it still took more than 20 years to reclaim its year-2000 high. Companies like Pets.com and Webvan disappeared entirely. Investors who held index funds navigated that period far better than those who concentrated in individual names.
The Real Risks in 2026 Look Different
The 2026 AI market does not carry the same risk architecture as dot-com 2000. There is no systemic leverage of the telecom-debt variety, and there are no large-scale hollow companies driving the rally. Today's risks take a different shape, and naming them correctly is the first step to managing them.
The first risk is a capex bet that has not yet paid off proportionately. Roughly $725 billion in annual capital spending is a large wager on future AI revenue. If real revenue growth does not keep pace with depreciation over the next few years, Big Tech profit margins will compress and valuations will adjust. This is an earnings risk, not a bankruptcy risk, but it is a real one.
The second risk is thematic portfolio concentration. Investors chasing AI stocks by theme can easily end up with 50–70% of their portfolio in five or six names. When that group corrects simultaneously, as history shows it does on a roughly 3-to-5-year cycle, the pain is far greater than it would be in a diversified portfolio.
How Should Vietnamese Investors Approach the AI Story?
The real question is not "Is AI a bubble?" It is "Which channel should I use to participate?"
For new investors who do not yet have the information or experience to select individual AI stocks, the most natural route is a global index fund or a technology-themed fund, available through Vietnamese open-ended fund platforms. An S&P 500-tracking fund still holds Nvidia, Microsoft, and Google at market-cap weights, but spreads the exposure across nearly 490 other stocks. If one AI name drops 70% the way Cisco did in 2002, the index fund still has 99% of its other holdings as a buffer.
For experienced investors who select individual stocks, the dot-com lesson worth internalizing is position sizing. Even the best company of that era took 20 years to recover its peak. The weight of any single AI stock in a portfolio should not exceed the level the investor can tolerate if that stock stays flat for an entire decade.
The dot-com bubble will not repeat itself exactly. But how an individual investor participates in the technology market — through individual stocks or through diversified funds — is the variable that determines whether history repeats for them personally. Cerebras' two-day swing in May captures this in miniature: same AI story, same stock, but the 70% surge and the 10% drop arrive in very different ways depending on whether you hold the name directly or through a broad basket.
Signals worth monitoring over the coming quarters: whether Big Tech earnings reports confirm that AI revenue is growing in line with capital spending, whether S&P 500 concentration continues to climb, and what earnings quality the next wave of AI IPOs will bring to the table.