

The big picture is posing an uncomfortable question for many investors: why is gold falling during a war?
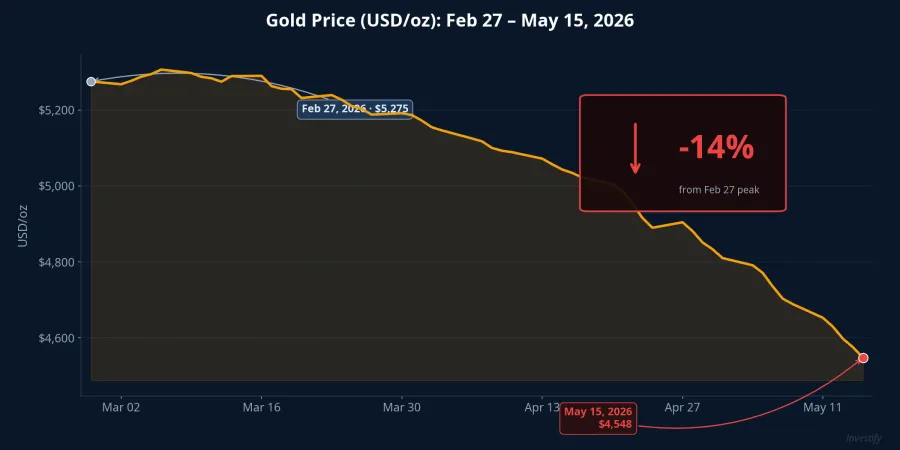
From its peak of $5,275 on February 27, 2026 to the May 15 close, gold dropped to $4,548/oz, losing nearly 14% over the very period when the Iran war showed no signs of calming and in fact escalated through multiple Strait of Hormuz incidents. Meanwhile, Brent crude rose roughly 37% and currently stands at $107.77 per barrel. Two assets, two completely opposite trajectories.
Understanding this paradox requires asking the right question: not "is geopolitics unstable?" but "where are real yields headed?"
A Familiar Belief Hits the Data
The reflex that "geopolitical instability means buy gold" has a fairly firm emotional foundation. Gold carries no one's debt obligation, is not easily nationalized, and has served as a wealth-protection store through centuries of conflict. In early 2026, the January US-Iran escalation pushed gold to an all-time high of $5,589 on January 28, consistent with the classic safe-haven playbook.
But when the actual war broke out at the end of February and continued through today, gold moved in the opposite direction. In Vietnam, SJC gold bars closed on May 15 at VND 161–164 million per tael, down another VND 1 million from the previous session; 9999 gold rings similarly fell to VND 160.8–163.8 million. Investors who bought SJC above VND 180 million back in January–February are now sitting on unrealized losses — the opposite of what the safe-haven narrative would predict.
The Real Mechanism: Oil Pushes Inflation, Inflation Pushes Real Yields
Understanding the mechanism starts with one basic principle: gold yields nothing. The opportunity cost of holding gold is the real yield on US government bonds, namely the nominal yield minus inflation expectations. When real yields rise, gold becomes less attractive than bonds and cash. When real yields fall, gold becomes more appealing.
The Iran war pushed oil sharply higher, and oil is an input for nearly every good and service. The result: US CPI for April 2026 jumped to 3.8% year-on-year, the highest since May 2023, with the energy index up nearly 18% year-on-year. The structural surprise was this: oil-driven inflation forced the Fed to keep rates high for longer, but long-term core inflation expectations did not rise proportionally because markets trusted the Fed could contain it. Nominal yields therefore rose faster than inflation expectations. Real yields moved up.
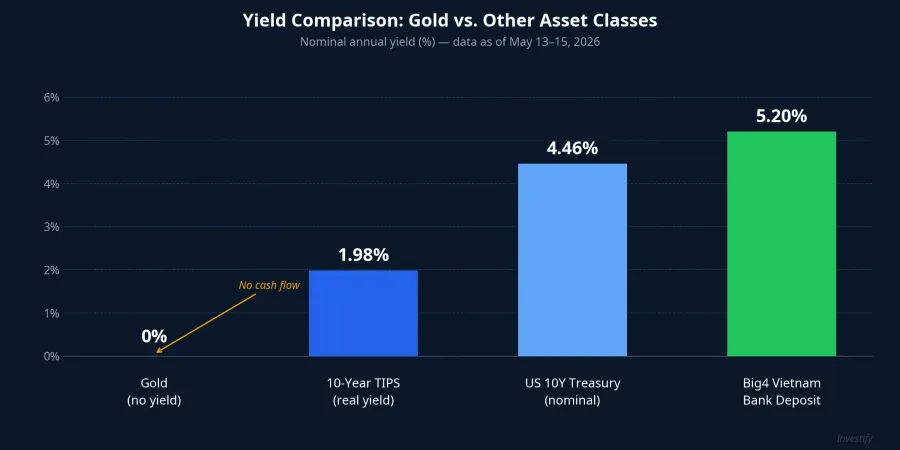
The specific numbers: the 10-year TIPS real yield closed at 1.98% on May 13, with the nominal US 10-year Treasury at 4.46%, near its highest level since mid-last year. For every $100 invested in short-dated bonds, an investor earns close to 2% real return per year; for $100 in gold, there is no cash flow at all, only the hope of price appreciation. That is a punishing environment for gold.

Historical Precedent: The Gulf War of 1990–91
The big picture shows the current cycle is not without precedent. The closest historical parallel is the Gulf War of 1990–91.
In August 1990, Iraq invaded Kuwait and oil prices surged. Gold had a very brief reflexive spike, then weakened throughout the rest of 1990 and the first half of 1991 even as the conflict remained hot. The reason is identical to today: the Fed tightened modestly to cap inflation expectations, real yields rose, the dollar strengthened, and gold found no foothold. Gold only stabilized once oil cooled, the US economy slowed, and the Fed pivoted toward easing in 1991–1992.
Looking further back, the 1973 oil shock drove US inflation sharply higher and the Fed aggressively raised nominal rates, pushing real yields up in the short term. Gold had bursts of strong gains, but a sustained bull cycle only materialized once inflation overwhelmed the Fed's capacity to respond in the late 1970s: when real yields fell deep into negative territory.
The common thread across all three episodes: gold rallies reflexively at the outset of a geopolitical shock, then faces sustained downward pressure or stagnation throughout the phase when inflation drives real yields higher, and only recovers durably when the macro environment reverses.
Warsh Takes Office: The Rate-Cut Door Closes Further
Fed Chairman Kevin Warsh was sworn in on May 13, 2026, exactly the week that April's US CPI was released at its highest level in nearly three years. Historically, Warsh has been among the Fed's hawkish voices on monetary easing and has pushed for reforms in how the Fed measures inflation. Although he has previously suggested the Fed should consider rate cuts, current data leaves him little room to act.
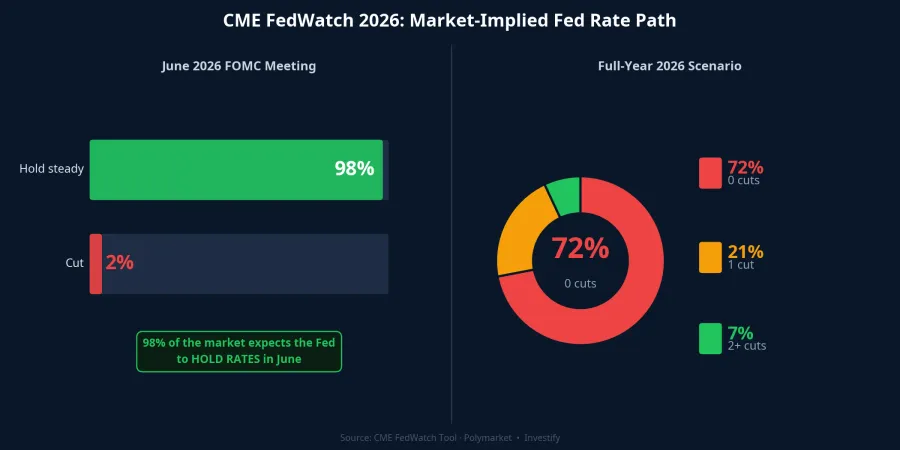
Markets are reflecting this clearly. The probability of the Fed holding rates steady at the June meeting is above 98%, and the probability of zero cuts for all of 2026 stands at roughly 72%.Yahoo Finance Traders on Polymarket are pricing in a 72.1% probability of zero cuts. BofA has pushed its forecast for the first cut to 2027. The Fed funds rate currently sits in the 3.50–3.75% range.
Three months ago, markets were pricing in multiple rate cuts for 2026 and gold climbed to an all-time high. When that bet was unwound, the correction did not show up on the geopolitics newswire — it showed up on the yield curve.
Real Yields Are the Benchmark, Not War Headlines
A direct comparison shows how disadvantaged gold's position is in the current capital allocation environment. The 10-year TIPS real yield stands at 1.98% per year, the nominal US 10-year Treasury at 4.46%, and Vietnam's Big4 12-month bank deposits offer roughly 5.2% per year. Gold pays no yield at all.
This does not mean gold has permanently lost its safe-haven role. The transmission channel has changed in this cycle: when a geopolitical shock comes packaged with oil-driven inflation that pushes real yields higher, gold must compete directly against yield-generating alternatives. Gold needs four conditions for a durable recovery: oil cooling back to the $80–90 range, US core inflation falling below 3% for several consecutive months, the Fed signaling a pivot toward easing, and 10-year TIPS real yields declining clearly from current levels near 1.98% to below 1.5%. Until those conditions are met, a sustained gold recovery remains a scenario, not a baseline.
Perspective for Vietnamese Investors Holding Gold
The spread between domestic SJC prices and the world spot price converted at current exchange rates remains elevated, due to limited physical gold supply and USD/VND exchange rate pressure. Vietnamese investors buying SJC today are not only betting on a global gold recovery; they also face an additional layer of risk from the domestic premium compressing if Decree 232/2025 opens up new supply channels in the second half of 2026.
A practical framework under current conditions: a gold allocation of 5–10% of a portfolio as a defensive buffer is reasonable, but not the weighting appropriate for a growth driver. Investors who bought SJC above VND 180 million in January–February are sitting on unrealized losses; cutting at VND 161–164 million only makes sense if they need cash flow or made an overweight allocation decision from the start. That decision does not depend on whether the macro story is finished.
Capital flows are clearly moving in line with real yields. Three signals are worth tracking over the next two weeks: Warsh's first public policy communication since taking office, May US CPI data expected in mid-June, and developments in the Strait of Hormuz. The right question is not "should I buy gold because geopolitics is unstable?" but "where are 10-year TIPS yields headed?" When real yields break below 1.5% on a downward trend, gold's story will have the foundation to be told again.