
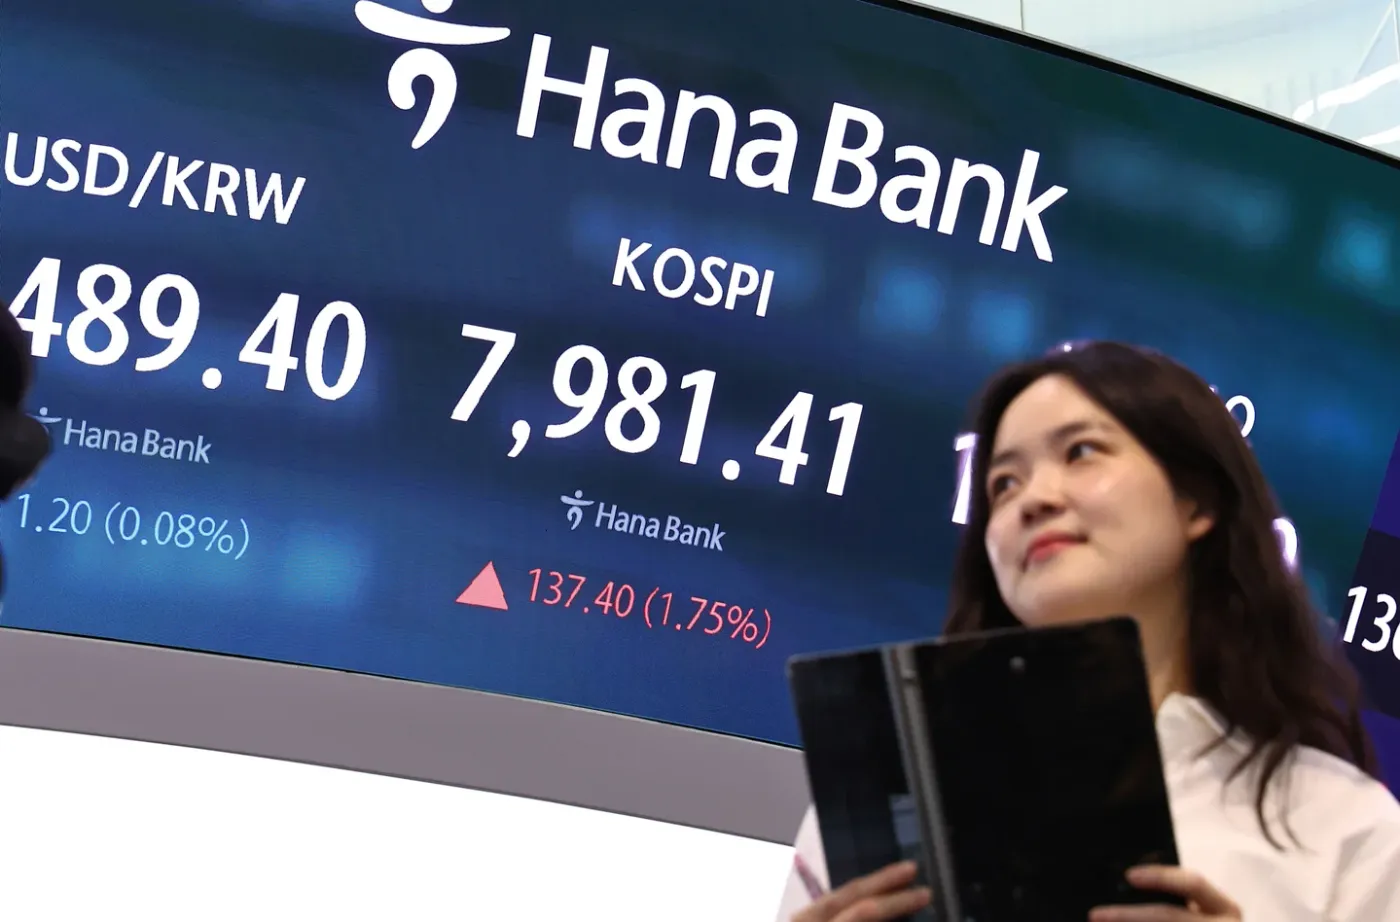

On the morning of May 15, KOSPI crossed the 8,000-point threshold for the first time in history.CNBC That same week, VN-Index closed May 14 at 1,925.46 points, a new all-time high for Vietnam's equity market. The headline reads simply enough: two of the region's major indices at record highs in the same week. But when you look beneath the surface, the two stories are fundamentally different. What is driving the rally in Seoul has very little to say about the outlook for Hanoi.
KOSPI 8,000: A Story of Two Memory Chips
KOSPI's 37% surge over the past month is not a broad story about South Korea's economic recovery.CNBC It is a story about one very specific product: high-bandwidth memory (HBM), the specialized chip used in Nvidia's next-generation AI servers.
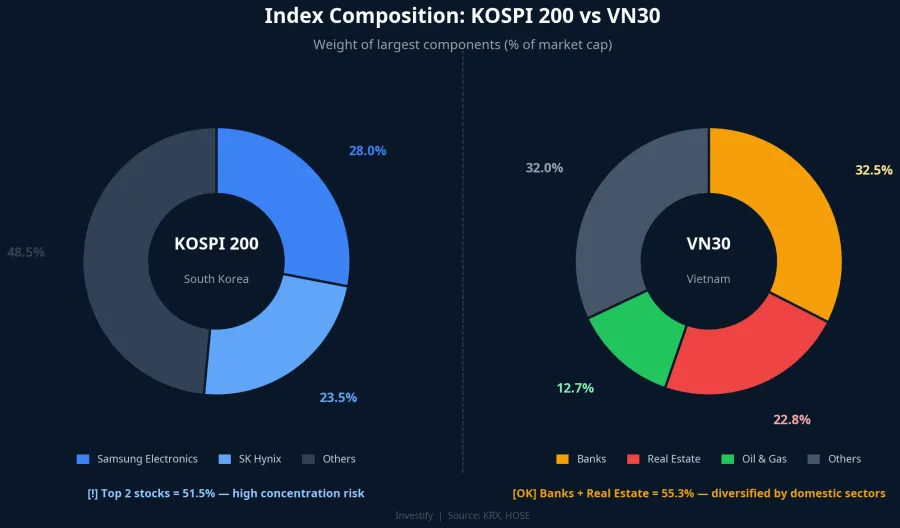
Samsung Electronics and SK Hynix now account for a combined 51.5% of the KOSPI 200 index, with Samsung at 28% and SK Hynix at 23.5%. Their combined weight has risen 12.8 percentage points in just five months, up from 38.7% at the start of the year.CNBC In other words, more than half of the entire index now sits in two names. When global investors pour money into the AI story through the memory chip route, nearly all of that flow goes into these two stocks.
SK Hynix currently holds approximately 70% of Nvidia's HBM orders.TradingKey In Q1 2026, SK Hynix posted an operating margin of 72%, surpassing Nvidia's 65%. For the first time in the history of the electronics industry, a memory chip supplier earned more per dollar of revenue than its end customer. This week, SK Hynix overtook Samsung Electronics in market capitalization, a role reversal that has never happened before in Korean electronics.Seoul Economic Daily
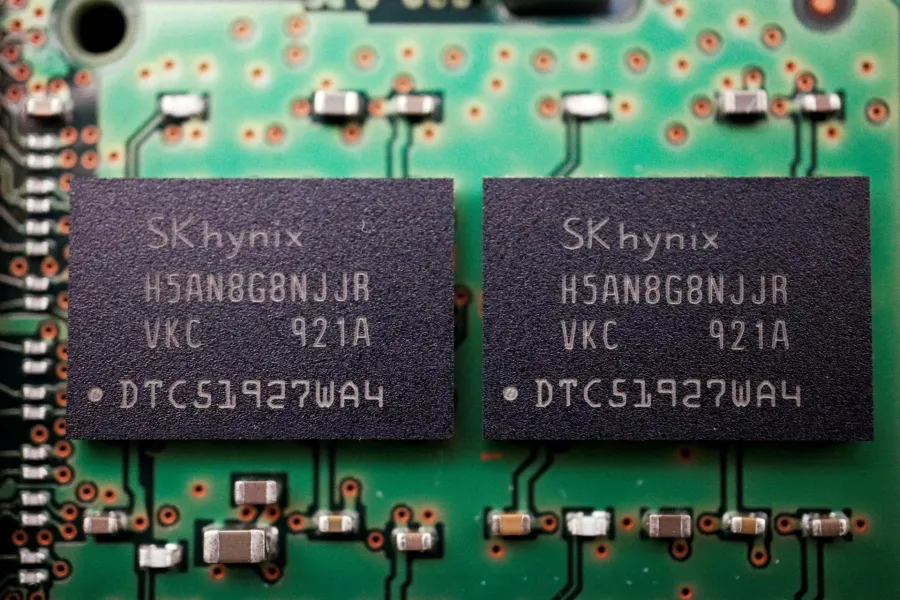
The HBM shortage is forecast to last through 2028, which is the fuel behind KOSPI's 37% one-month advance.TradingKey But that same dependency is the index's structural vulnerability: when more than half the index is tied to a single technology cycle, the potential for volatility in both directions is enormous.
VN-Index 1,925: A More Distributed Rally
VN-Index reached its peak through a different logic entirely. The index's weight is spread across multiple sectors and multiple economic cycles. Within the VN30 basket, the banking group — VCB, BID, CTG, MBB, ACB, VPB, HDB, VIB — accounts for roughly 32.5% of the weight; real estate accounts for around 22.8%; oil and gas around 12.7%; with steel, chemicals, and other industries making up the rest. The largest stock pair — typically VCB alongside VHM or VIC — only reaches 13–16% of total weight combined. No two stocks come close to controlling half the index, as they do in KOSPI 200.
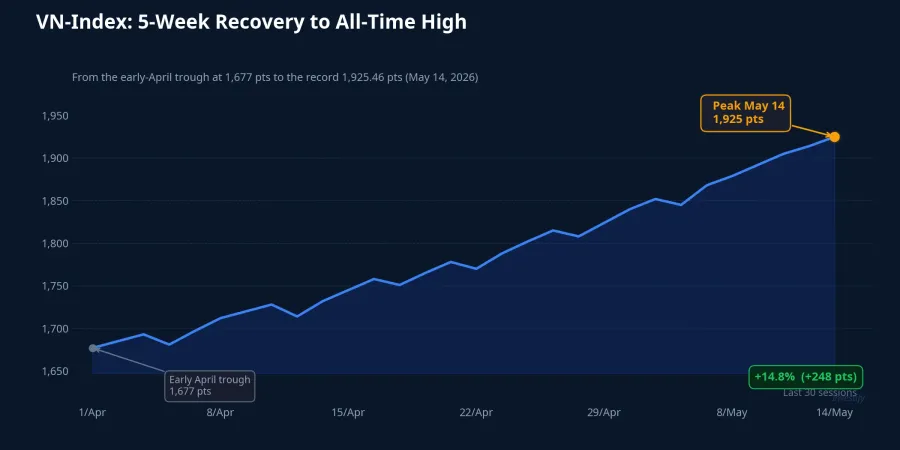
From the April 7 session to May 14, VN-Index climbed from 1,677.54 to 1,925.46 points, a gain of approximately 14.8% over five weeks. That advance was distributed across multiple sectors: oil and gas (GAS, BSR), state-owned banks (VCB, BID), and the Vingroup cluster (VHM, VIC). Notably, on May 14, oil and gas and Vingroup led while several bank and real estate names dipped. This is the hallmark of a market where sectors take turns pulling the index higher rather than one sector pulling everything.
This structure has a direct practical implication for individual investors. A 10% decline in VN-Index would require a shock broad enough to hit banking, real estate, oil and gas, and other major groups simultaneously. It would require a macro-level event with wide reach: a significantly tighter Fed, a sharp spike in USD rates, or a major geopolitical development. KOSPI, by contrast, only needs one bad quarter from SK Hynix.
Concentration Risk: What History Tells Us
This is not the first time a market index has become dangerously dependent on a single name. History offers two of the clearest lessons.
Nokia and the Finnish market is the classic case. At its peak in 2000, Nokia accounted for roughly 70% of the Helsinki exchange's market capitalization and approximately 4% of Finland's GDP.Wired When the iPhone arrived and Nokia lost its dominant position after 2007, the Finnish equity market endured a decade of stagnation. The economy itself was not fundamentally weak. The index was simply too dependent on one name.

Nvidia's role in the S&P 500 through 2024–2025 offers a more recent parallel. There were sessions when Nvidia alone accounted for the majority of the S&P 500's daily move. When Nvidia fell a few percent on concerns about slowing AI chip demand, the entire index fell, even though the other 499 stocks had no bad news of their own. KOSPI 200 today is in a similar position, but at a larger and more concentrated scale: two stocks instead of one.
What could reverse KOSPI's rally? At least three scenarios are worth tracking: Nvidia adjusting the delivery schedule for its GB300 chip, Samsung falling further behind in HBM3E certification, or a new escalation in semiconductor geopolitics. With 51.5% of the index concentrated in two names, any correction that materializes will likely be fast and deep.
Which Signals Actually Matter for a Vietnam Portfolio
When you see the headline "global markets at all-time highs" this morning, the key is to disaggregate the signals correctly. KOSPI 8,000 is news about the Korean memory chip market. It is not a signal for a Vietnamese equity portfolio.
The variables that actually drive VN-Index in this environment are: the USD and US Treasury yields (which directly affect foreign fund flows into HOSE), Brent crude (which moves GAS, BSR, PVD, and the oil and gas sector currently leading the market), Q1 2026 earnings results from Vietnam's major banks, and overall market liquidity. On May 14, trading volume on HOSE reached 672 million shares, the highest level of the month and a sign that capital has not pulled back.
If liquidity fails to hold above VND 25,000 billion in traded value per session through this week, the probability of a technical pullback of 3–5% from the 1,925 area increases materially. But that is a domestic signal, not one coming from Seoul.
Same Peak, Different Risk
VN-Index at 1,925 and KOSPI at 8,000 are two events happening at the same time but telling two different stories. KOSPI carries extreme concentration risk: more than half the index depends on one technology cycle and the fortunes of two companies. VN-Index has a considerably more distributed structure. Risk exists, but it comes from broader macroeconomic variables, not from a single stock pair.
For investors to consider: At all-time-high territory, maintaining a 15–20% cash allocation and trimming positions that have gained 20–30% is a common risk management framework, not a recommendation on any specific stock.
Key signals to watch over the coming week: the USD Index and 10-year US Treasury yield, Brent crude relative to the USD 70 level, Q1 2026 earnings from VCB and BID, and HOSE daily traded value relative to the VND 25,000 billion threshold. These figures will answer the question of whether VN-Index can hold its record territory. KOSPI 8,000 cannot answer that question for you.