

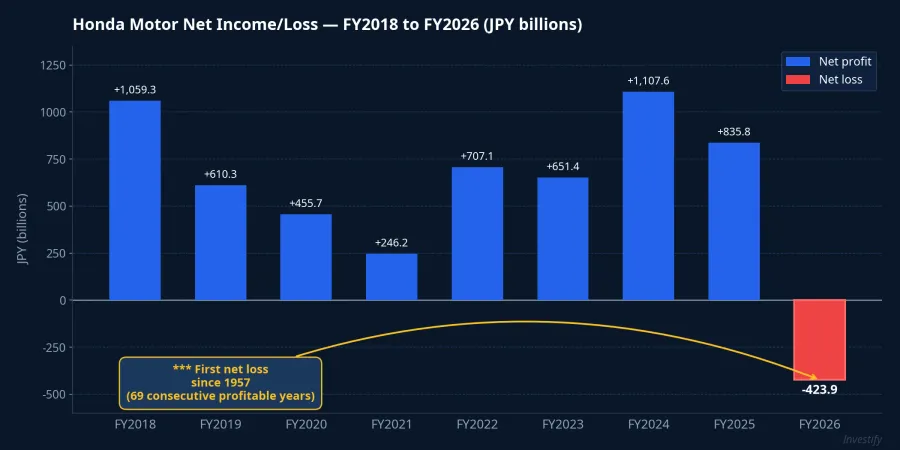
On May 14, 2026, Honda Motor reported results for its fiscal year ending March 31, 2026: a net loss of JPY 423.9 billion, approximately USD 2.7 billion. It is the first time Honda has posted a full-year loss since 1957, ending a 69-year streak of profitability that survived two oil shocks, the 2008 financial crisis, and pandemic-era supply chain disruptions without a single annual red figure.CNN
This time it did. And the cause came from within.
Losses That Were Largely Self-Inflicted
Looking at the breakdown, the most striking finding is that the loss was driven not by a revenue collapse but by one-time charges linked to a strategic reversal on electrification. According to Honda's March 2026 announcement, EV-related costs in the fiscal year just ended reached JPY 1,577.8 billion alone.Honda IR
Accumulated over two consecutive fiscal years, total losses tied to the all-electric strategy are estimated at approximately JPY 2,500 billion, or around USD 16 billion.ABC News The charges include supplier compensation after Honda cancelled three North American EV models (Honda 0 SUV, Honda 0 Saloon, and Acura RSX), along with asset impairments and facility closure costs for EV production sites built during the expansion phase. These are the tuition costs of a strategy designed at peak optimism that reality revised downward.
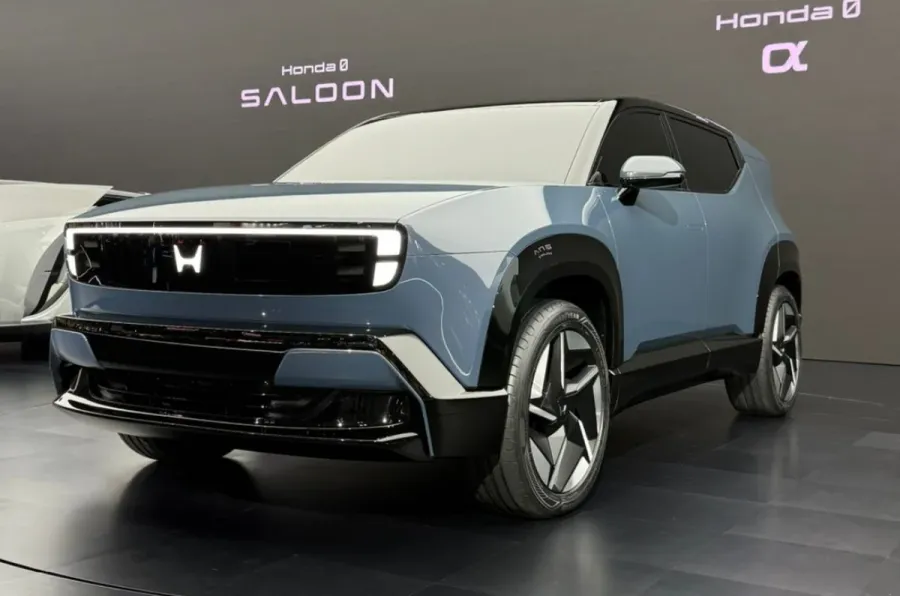
Also on May 14, Toshihiro Mibe, Director, President and Representative Executive Officer (Global CEO) of Honda Motor Co., Ltd., announced the new direction: cancelling the 2040 target of 100% EVs and fuel-cell vehicles, redirecting resources toward 13 next-generation hybrid models launching from 2027, and scrapping the EV joint venture with Nissan.Honda IR Honda now forecasts a return to net profit of JPY 260 billion (approximately USD 1.7 billion) for the fiscal year ending March 2027, with operating profit expected around JPY 500 billion.Yahoo Finance
Toyota the Same Year: Pressure, But Still Profitable
To understand what went wrong, it helps to look at Toyota in the same fiscal year. Toyota's consolidated revenue reached JPY 50,684 billion (approximately USD 335.7 billion), up 5.5%.Toyota IR Operating profit came in at JPY 3,770 billion, down 21.5% year-over-year as US import tariffs on Japanese vehicles created an estimated USD 8 billion drag.CNBC That is the same headwind Honda faced. The difference is that Toyota maintained an operating margin above 7%, remained profitable by thousands of billions of yen, and wrote off no EV projects.
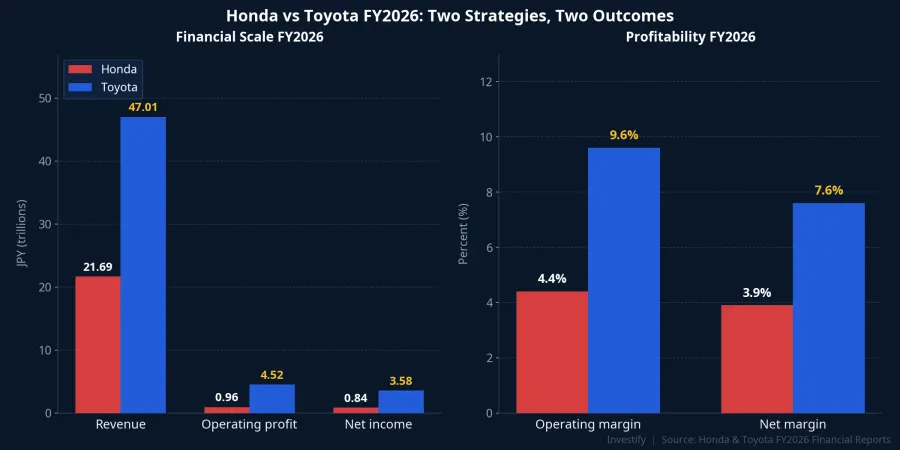
Toyota pursued a strategy that many investors labelled "backward" from 2020 through 2024: prioritizing hybrid, approaching battery EVs on a measured timeline, and spreading R&D budgets across multiple powertrain types rather than committing everything to one direction. Hybrid sales continued to grow steadily through 2025 and 2026, generating cash flow sufficient to absorb EV transition costs that were kept manageable precisely because Toyota was not doing too many things simultaneously.
Two Japanese automakers, same home country, same US tariff exposure, selling into the same markets. One posted a historic loss. The other absorbed a profit decline but remained deeply profitable. The difference was not whether to go electric — both are — but the speed and scale of capital commitment.
EV Adoption Reality: Slower and More Uneven Than 2021-2022 Forecasts
Honda built its investment plans around projections from 2021 and 2022, when EV enthusiasm was peaking. Those forecasts traced a linear path toward 100% electrification. The actual trajectory looked quite different.
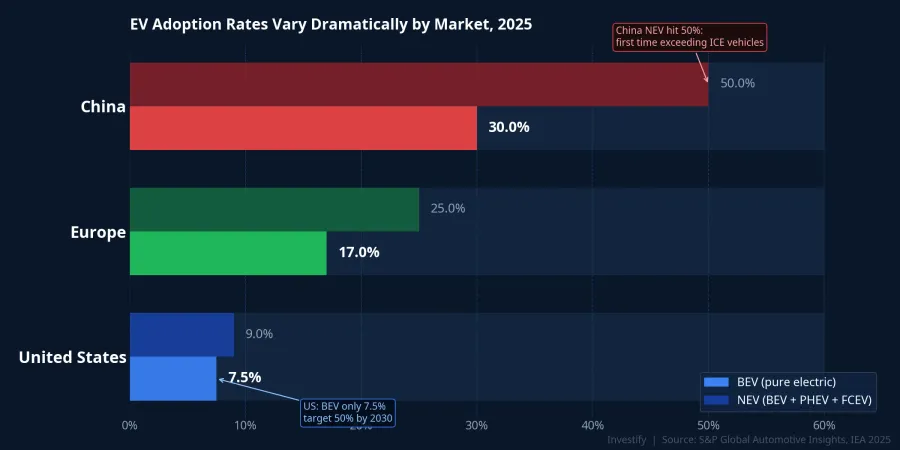
In the United States, pure battery EVs (BEV) accounted for just 7.5% of new vehicle sales in 2025, while new energy vehicles (NEV, including plug-in hybrids) reached only 9%. Charging infrastructure remains uneven, total cost of ownership still runs above gasoline vehicles, and tax incentives have been rolled back. Most new electrification demand in the US has been absorbed by hybrids.
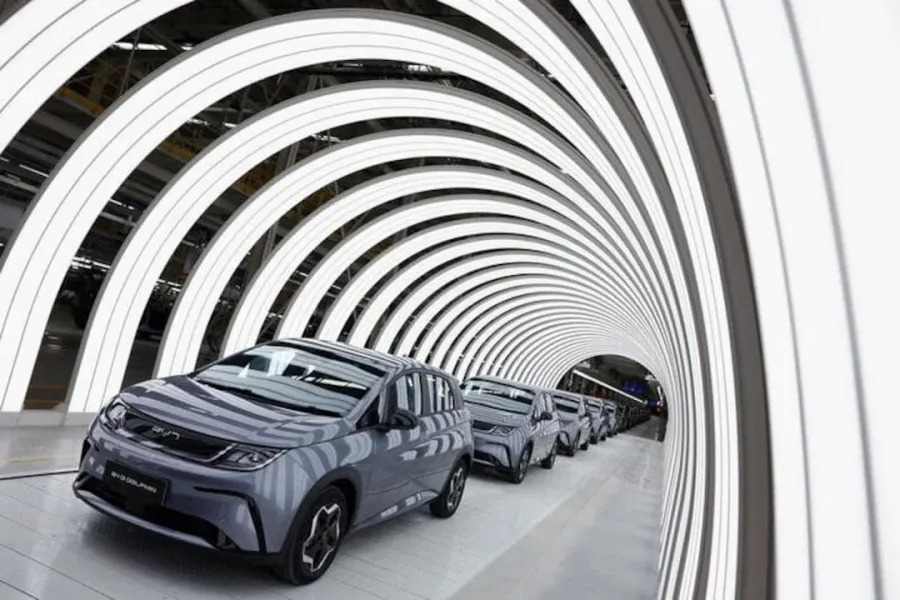
In China, NEVs reached 50% of new car sales in 2025, overtaking combustion vehicles for the first time. Yet even in the world's most advanced EV market, the price war led by BYD — which sold over 2 million EVs in 2025 — has pushed every foreign automaker's margins into negative territory. Honda could not simultaneously compete on price against BYD in China and absorb large-scale transition costs in North America during the same period.
Europe remained below 25% NEV. The global picture is neither uniform nor linear. When the actual curve diverges from the assumed curve in a capital plan, every dollar already committed must be written down.
Four Questions Before Buying Into a Technology Transition
Honda's story is not evidence that EVs will lose to hybrids. The real lesson is about committing capital to a long-term trend without correctly reading adoption speed market by market. For individual investors — especially those new to markets — this framework applies directly to any sector being sold with the same "the future is certain" pitch: artificial intelligence, renewable energy, fintech, precision agriculture.
Where is actual adoption today, and in which markets? What share of new purchases in the company's target market uses the new technology right now. A forecast of "50% by 2030" says nothing about the trajectory from here to there.
Can the cost structure survive the transition period? How much is the company burning each year, how many more years of burn are required, and where does the capital come from. Honda had motorcycle and gasoline vehicle cash flow as a backstop. A pure-play EV startup has no equivalent safety net.
Where are the low-cost competitors, and how far can they discount? BYD compressed Honda's margins in China through vertical integration and manufacturing scale. Every technology transition sector has a potential "BYD": typically from China, with home-market policy support.
How many contingency paths does the company have? Toyota kept hybrids alive when EV uptake slowed. Honda bet one direction and reversed course at enormous one-time cost. A business plan that only works in one scenario is a plan without a margin of safety.
The Core Lesson and Signals to Watch
Believing in a long-term trend is not a mistake. The mistake is assuming a specific timeline for that trend without verifying it against actual adoption data across individual markets. Honda will return to profitability and will continue participating in global electrification. But USD 16 billion in adjustment costs is now a permanent entry in the historical record.
Key indicators to monitor in the coming quarters: whether Honda's new hybrid lineup launching from 2027 achieves target volume, whether operating margin recovers above 5%, and whether US tariff pressure on Japanese vehicles eases through the next round of trade negotiations.