

The Paradox Between Price and Margin
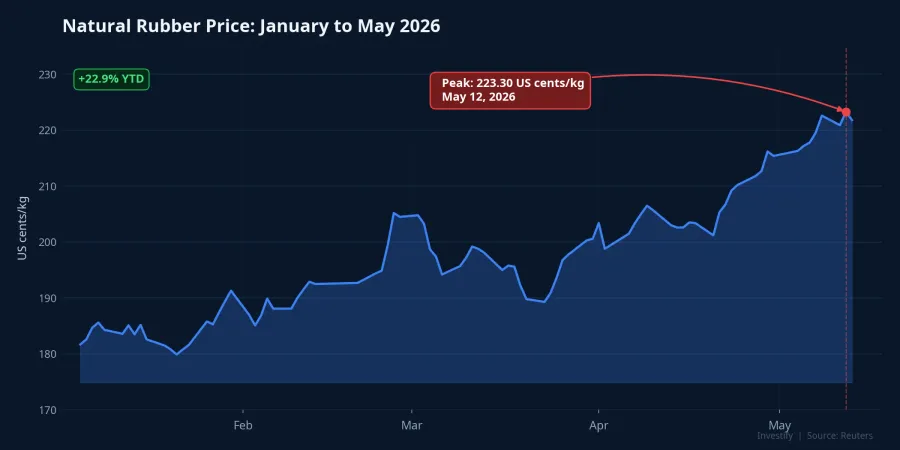
On May 12, 2026, natural rubber settled at 223.30 US cents/kg, its highest level since February 2017. Year-to-date, the gain stands at 22.89%. Equity markets responded accordingly: GVR climbed from VND 31,400 in early April to VND 36,800 on May 13, a roughly 17% gain in just six weeks. Market capitalization now stands at VND 147.2 trillion.
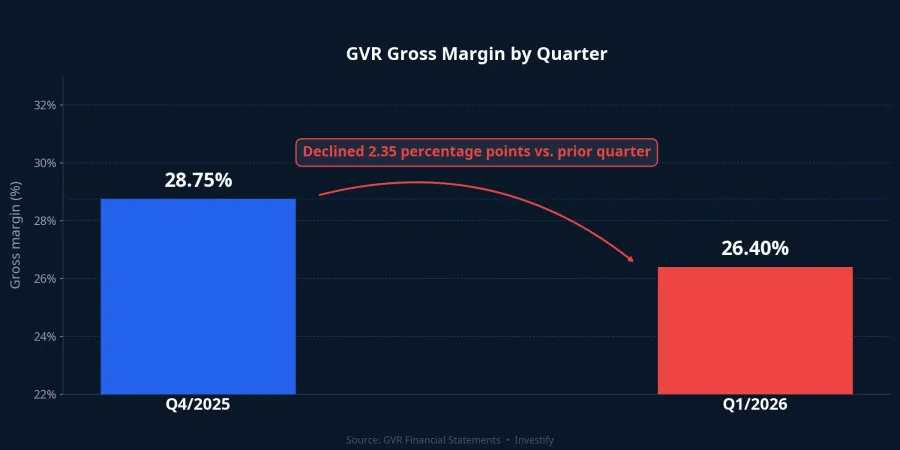
Q1/2026 financial statements tell a different story. GVR's revenue came in at VND 8,850.1 billion, up a modest 2.22% from the prior quarter. Gross margin was 26.40%, down from 28.75% in Q4/2025. Across all three sector names — GVR, DPR, and PHR — gross margins contracted despite strong year-over-year revenue growth.
The point worth examining is not that share prices are rising. It is why gross margins have yet to reflect spot market prices. Understanding that mechanism is essential before evaluating rubber stocks as a group.
Six Consecutive Years of Demand Outpacing Supply
The structural backdrop did not begin this year. According to the Association of Natural Rubber Producing Countries (ANRPC), 2026 marks the sixth consecutive year in which global demand has outstripped production. Global supply is projected at approximately 15.2–15.32 million tonnes versus demand of roughly 15.6 million tonnes. The supply deficit is forecast at nearly 400,000 tonnes for 2026 and could widen to 600,000–800,000 tonnes annually by 2028 if current trends hold.Ecofin Agency
On the demand side, two forces are compounding: a strong recovery in automotive and tyre manufacturing across China and India, combined with elevated crude oil prices that have made synthetic rubber more expensive, nudging tyre producers to substitute a portion of demand back toward natural rubber. On the supply side, rubber plantations across Southeast Asia are aging and investment in replanting has been largely frozen through a decade of depressed prices.
Beyond the long-run structural pressure, La Niña is adding near-term disruption. Unusually heavy rainfall across Thailand and Vietnam — two of the world's three largest exporters — has shortened tapping days during the peak harvest season, raised plantation maintenance costs, and disrupted delivery schedules. The southeastern and central highland regions of Vietnam, where the majority of GVR, DPR, and PHR plantations are concentrated, are directly in the affected zone.
Vietnam and GVR Within the Global Cycle
Vietnam is the world's third-largest natural rubber exporter after Thailand and Indonesia, with annual national production of around 1.3 million tonnes, more than 80% of which is exported.Ministry of Finance GVR is the state-owned conglomerate with the largest plantation acreage in the country. That structural scale advantage becomes more valuable as the commodity price cycle turns upward.
That advantage, however, has not yet fully translated into Q1/2026 financial results due to the seasonal characteristics of the industry. GVR's share price is running ahead of the data: a market capitalization of VND 147.2 trillion implies the market is pricing in expectations for future quarters, not last quarter's results. Those expectations require validation from actual gross margins starting in Q3.
Three Mechanisms Behind the Q1 Margin Contraction
Looking at GVR's 26.40% gross margin in Q1/2026 — down 2.35 percentage points from Q4/2025 — three mechanisms were operating simultaneously and are worth examining together rather than in isolation:
Timing lag between spot prices and realized prices. The peak of 223.30 US cents/kg occurred on May 12, meaning it falls squarely in Q2. The bulk of Q1 volume was sold from inventory built in late 2025 or under contracts priced at lower levels. Spot price increases had not yet flowed through to Q1 realized revenue.
Q1 is the off-season for rubber tapping. Peak tapping in Vietnamese growing regions falls in Q3 and Q4. During Q1, volumes are lower while fixed costs — labour, plantation maintenance, depreciation — accrue at their full rate. Fixed cost absorption over a smaller revenue base mechanically compresses gross margins.
Input costs rose ahead of selling prices. Fertilizer, energy, and labour costs responded to the commodity cycle earlier than rubber selling prices. The result was cost of goods sold growing faster than revenue in Q1, squeezing margins from both sides simultaneously.
None of these three mechanisms signals a structural deterioration. They are natural features of the transition phase in a commodity cycle: when spot prices move ahead, realized margins need time to catch up through new contracts and the main tapping season.
DPR and PHR: Same Pattern, Different Profit Sources
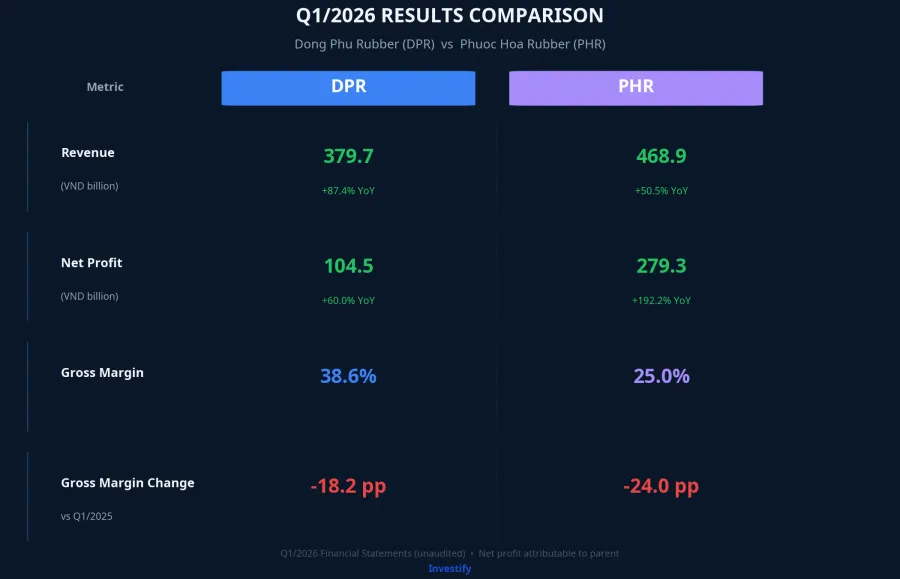
DPR and PHR show the same structural result: strong YoY revenue growth, net profit growing faster than revenue, and gross margins declining by double-digit percentage points compared to the prior year.
DPR recorded Q1/2026 revenue of VND 379.74 billion, up 87.45% year-over-year. Net profit attributable to the parent was VND 104.52 billion, up 60% YoY. Gross margin stood at 38.64%.Elibook PHR reported revenue of VND 468.86 billion, up 50.52% YoY; net profit of VND 279.29 billion, up 192.24% compared to the same period last year. PHR's gross margin was 25.01%.Elibook
The quality of the profit warrants a closer read. PHR nearly tripled its net profit while gross margin fell nearly 24 percentage points against Q1/2025. That gap was bridged primarily by one-time land compensation income from industrial zone projects and financial gains. These items will not recur in the next quarter and do not reflect the quality of core rubber operations. DPR shares a similar structure, just at a smaller scale.
One structural observation worth keeping in mind when comparing all three tickers: DPR's 38.64% gross margin is materially higher than PHR's 25.01% or GVR's 26.40%. Within the same commodity price cycle, margin quality is a meaningful differentiator.
Risks to Keep in the Analysis
A nine-year price peak provides a substantial buffer if La Niña reduces volumes by 5–10%. But the price-offsetting assumption only holds if the elevated price level is sustained long enough to feed through into Q3 and Q4 contracts. If Chinese demand slows, or if lower crude oil prices bring synthetic rubber costs down, the current price run may not outlast the main tapping season.
A longer-horizon variable is the EU Deforestation Regulation (EUDR). Companies that can demonstrate supply chain traceability will retain access to EU markets at premium prices. Those that adapt slowly risk being pushed toward lower-priced markets, degrading their revenue mix in the medium term.
Three Data Points to Watch Next Quarter
The current story is not a straight line from "higher prices" to "higher profits." Q1/2026 has shown that gross margins can move in the opposite direction to spot prices during a transition phase. The structural thesis for the rubber cycle is well-supported: six consecutive years of supply deficit are not easily dismissed. But genuine confirmation comes in Q3, when the main tapping season and current price levels appear on the same income statement.
Three data points to monitor: GVR's Q2/2026 gross margin, rubber tapping volume in June and July across the southeastern and central highland regions, and the share of core rubber operating profit versus total net profit in PHR's and DPR's Q2 reports. These three figures will clarify how much of the profit growth is attributable to the commodity price cycle versus items that will not repeat. That is when the cycle thesis either gets confirmed or requires revision.