

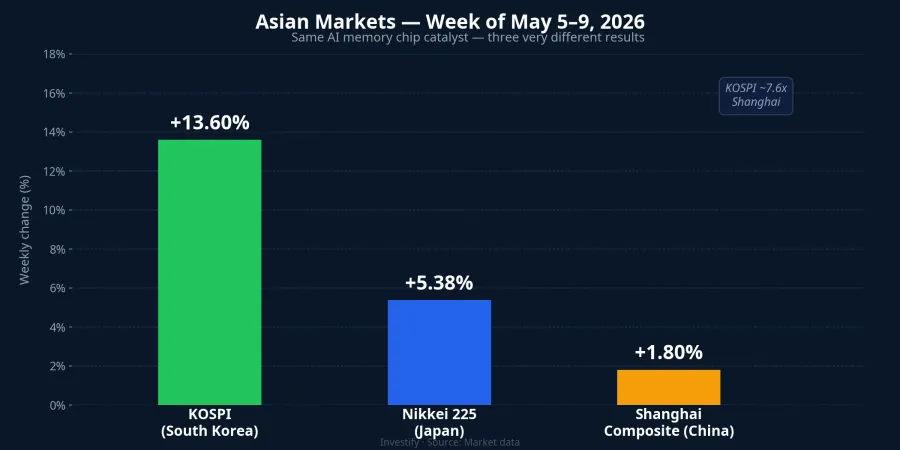
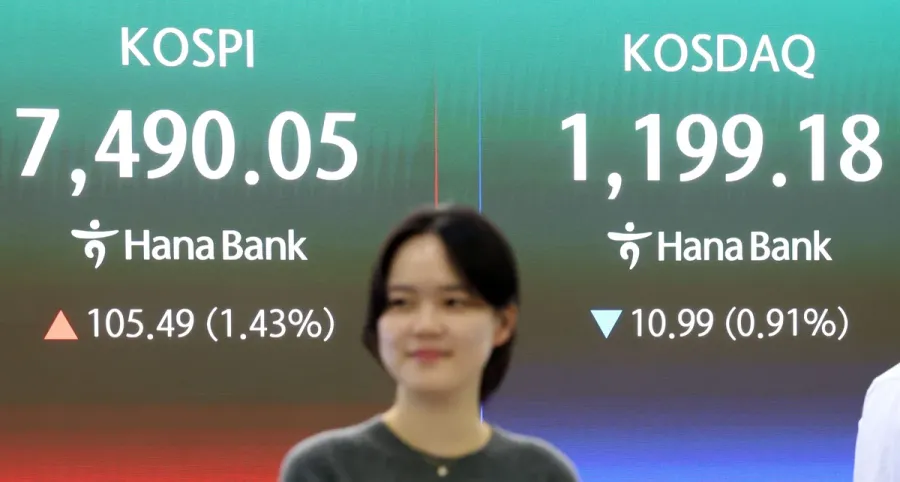
During the week of May 5–9, 2026, three of Asia's major stock markets absorbed the same catalyst: the tightest AI memory chip shortage cycle in nearly two decades. The results: South Korea's KOSPI rose 13.6% to 7,498 points — the strongest weekly gain since 2008 — while Japan's Nikkei 225 advanced 5.38% to 62,713 and China's Shanghai Composite gained just 1.8% to 4,179.95.Seoul Economic Daily The gap between South Korea and China reached nearly eightfold, despite the same region, the same week, the same news.
What's significant about these numbers is that the divergence did not come from investor sentiment or hot-money flows. It came from something far more fixed. Which stocks sit inside each index, and what percentage of market capitalization each one represents: that is what determines performance when a single sector surges, not the geographic label on the fund wrapper.
Samsung and SK Hynix Dragged the Entire KOSPI Higher
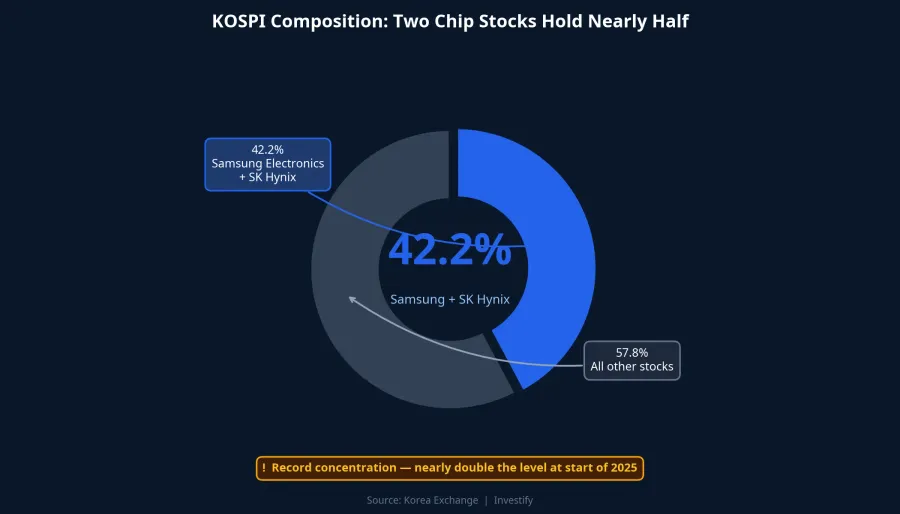
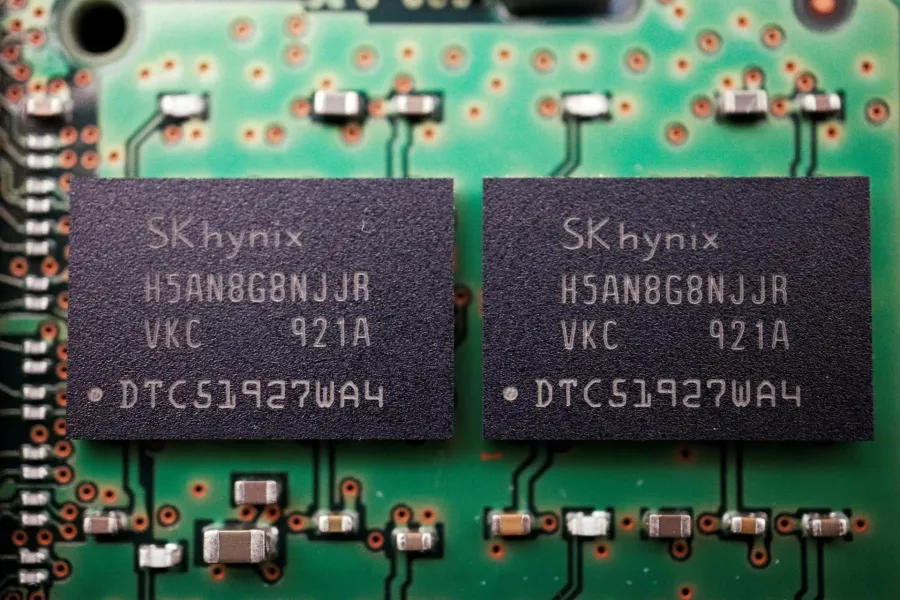
To understand why KOSPI moved so dramatically, you have to look at market-cap composition. According to the Seoul Economic Daily on May 5, 2026, Samsung Electronics and SK Hynix together accounted for 42.2% of KOSPI's total market capitalization — a record concentration, nearly double the 22.6% figure at the start of 2025.Seoul Economic Daily In ETFs focused on the KOSPI50, the two names accounted for 64.5% of the basket. That level of single-sector concentration in two stocks is almost unparalleled among major global indices.
Both stocks led the market last week. Samsung Electronics surged nearly 15% in a single session on May 6, pushing its market capitalization past KRW 1,500 trillion and placing it alongside TSMC in Asia's trillion-dollar club.CNBC SK Hynix set all-time highs on two consecutive sessions, crossing KRW 1.6 million per share, with year-to-date gains exceeding 146%.
The mechanism is straightforward: a market-cap-weighted index amplifies whichever group is largest in the basket. When that group holds 42% of total market cap and stages a strong weekly rally, the rest of the market essentially just provides background noise. KOSPI's 13.6% weekly gain was not the whole Korean market rising in unison. It was largely Samsung and SK Hynix surging, pulling the index with them, while the rest of the Korean market moved considerably more modestly.
Shanghai Composite: A Domestic-Oriented Basket That Missed the Chip Wave
The Shanghai Composite's composition is nearly the mirror image of KOSPI's. According to Siblis Research data, the financial and real estate sector accounts for 27.4% of the index's total market capitalization, with industrials at 18.7%.Siblis Research This is a basket tilted toward state-owned banks, large industrial conglomerates, and domestic consumption names. There are essentially no global-scale DRAM or HBM memory chip producers in this index.
When the AI memory chip news swept across the region, Shanghai had no sector leverage to capture that tailwind. Some Chinese technology names did react, but their small weighting in the index limited the impact on the headline number. Shanghai's 1.8% gain for the week accurately reflects its internal structure: a domestically oriented market with little exposure to the global memory chip supply chain. Two investors holding "Asian equity funds" — one with a Korea-heavy basket, one with a China-heavy basket — received returns that diverged by nearly eightfold in the same week.
Nikkei 225: Technology Exposure Without a Dominant Name
The Nikkei 225 sits between the two extremes. Technology accounts for roughly 54% of the Nikkei's basket — higher than KOSPI's total tech weighting.Wikipedia However, that weighting is distributed across many names: Advantest (semiconductor testing) at around 10%, Tokyo Electron (chip equipment), SoftBank, Fast Retailing, and dozens of other technology and industrial companies. No single name holds 20% or 15% of the index the way Samsung does in KOSPI.
When AI chip news improved, Advantest and Tokyo Electron did rise, but the rest of the basket — consumer, traditional industrial, and financial names — responded only modestly. The result: Nikkei gained 5.38%, stronger than Shanghai but well below KOSPI. This is a textbook case of having sector exposure without a dominant single name to act as a performance amplifier.
The Memory Chip Shortage Is at Peak Tightness
The broad backdrop driving this record weekly gain is a supply-demand cycle for memory chips at its tightest point. On the demand side, the four largest cloud computing giants — Amazon, Google, Microsoft, and Meta — plan to deploy approximately USD 725 billion in infrastructure capital expenditure in 2026, with the majority flowing into AI infrastructure.Tom's Hardware Demand for HBM (High Bandwidth Memory) used in AI GPUs is driving requirements across the entire memory supply chain.
On the supply side, SK Hynix's and Samsung's HBM capacity for 2026 is nearly fully booked. Manufacturers are prioritizing conversion of production lines from conventional DRAM to higher-margin HBM, creating simultaneous shortages in both segments. In the U.S. market, Micron gained 38% for the week to USD 746.81 — its strongest weekly advance since December 2008.CNBC
One important caveat: KOSPI's 13.6% weekly gain is an extreme response, the compressed result of a shortage cycle at its peak. This magnitude of weekly move should not be expected to repeat regularly. The structural divergence between KOSPI and Shanghai, however, is permanent. It does not depend on any particular week, but on which index contains globally-scaled memory chip producers.
What This Means for Vietnamese Investors
There are currently no domestic Vietnamese ETFs tracking KOSPI or an Asia basket with meaningful Korea weighting. Equity funds managed by Dragon Capital, SSIAM, and DCVFM all focus on Vietnamese stocks. Investors seeking Korean market exposure typically need to open an international trading account through a brokerage that offers such services, or purchase U.S.-listed ETFs such as the iShares MSCI South Korea (EWY) or iShares MSCI Asia ex-Japan (AAXJ) through international investment platforms.
The more important lesson, however, is not about picking a specific Korean fund. It is broader and applies to any foreign equity ETF or mutual fund: before committing capital, read the fund's top-10 holdings and sector breakdown. Two funds both labeled "Asia" can have radically different compositions. One basket is heavy on Korean memory chips; another is heavy on Chinese financials. The past week demonstrated that the resulting performance gap can reach nearly eightfold.
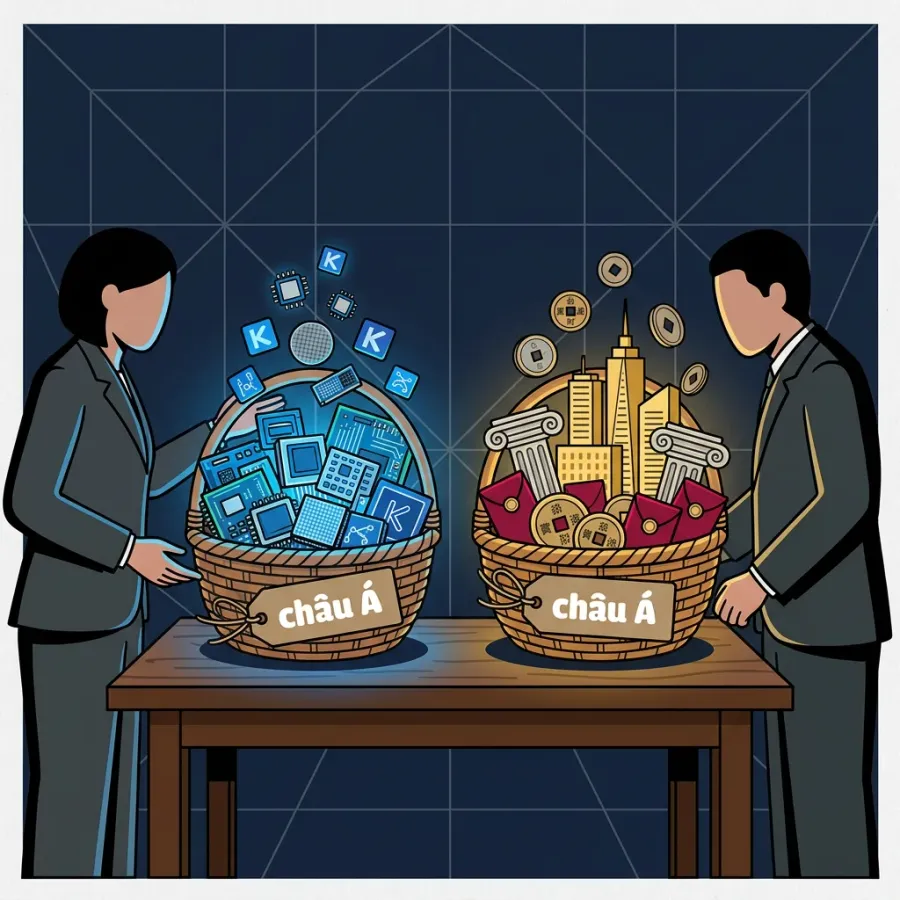
This does not mean every basket should be overweight memory chips. Each composition has its own cycle: a China-financial-heavy basket will outperform sharply when Beijing stimulates domestic credit; a Nikkei-heavy basket benefits when a weak yen boosts Japanese exports. What matters is that investors understand what they actually hold before market events create performance divergence.
The lesson from the week of May 5–9, 2026 is straightforward: the geographic label on a fund is only the outer packaging. What actually determines your portfolio outcome is which stocks sit inside the basket and what percentage weight each one carries. With that understanding, investors can ask the right question before selecting a fund: which sector do I actually want to access, and does this basket genuinely reflect that?