

On the morning of May 4, S&P Global released Vietnam's Manufacturing PMI for April at 50.5 points, down from 51.2 in March.VnEconomy New orders fell for the first time in eight months, output growth slowed to a 10-month low, and firms simultaneously cut employment, purchasing, and inventories.Vietstock The instinctive read: sell manufacturing and export stocks — HPG, VHC, garment names — because demand is softening. The logic is sound in theory.
The May 4 session did not follow that theory.
May 4: Oil & Gas Led, Real Estate Hit Hardest
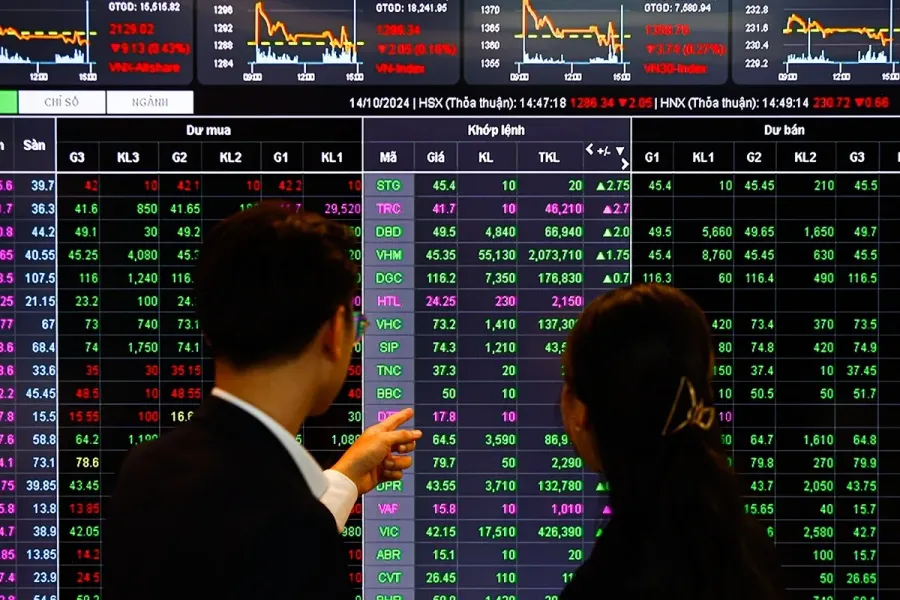
The VN-Index closed at 1,854.06 points, essentially flat versus its pre-holiday close.Vietstock But underneath that stillness was a striking divergence across sectors.
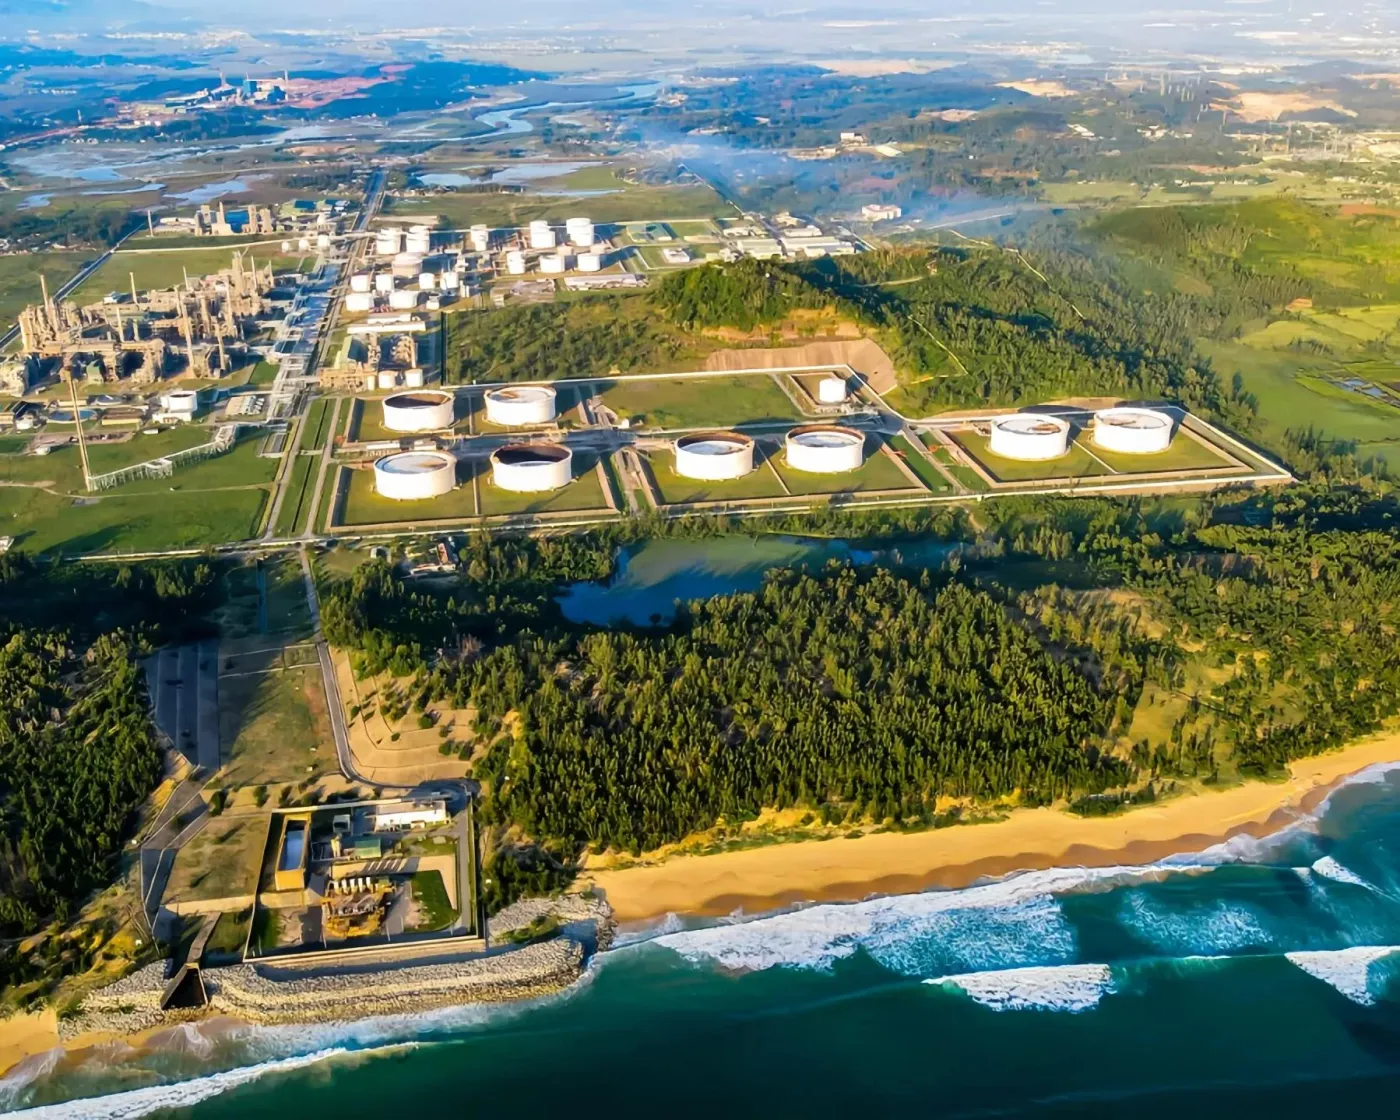
The oil and gas group led the market with broad-based gains. BSR — Binh Son Refining and Petrochemical — hit the daily upper limit at VND 25,250 per share, up 6.99%. PVS rose to VND 39,300 (+3.42%), PVD to VND 31,750 (+2.42%), and GAS to VND 76,500 (+1.73%). Four oil and gas names advancing in unison on a flat-market day signals deliberate capital rotation, not noise.
Real estate moved in the opposite direction and was the worst-performing sector of the session.Vietstock NVL hit the daily floor at VND 19,100 (-6.83%), while VIC, VHM, TCH, and IDC all closed in the red. What makes this notable is that real estate falls entirely outside the scope of manufacturing PMI. Yet it was the sector sold most aggressively on the very day the PMI was announced.
One PMI release, one flat index. Yet the market bought oil and gas heavily and sold real estate just as hard. That looks like a contradiction on the surface. Beneath it lies a consistent mechanism.
PMI at 50.5 Due to Cost-Push, Not Demand Collapse
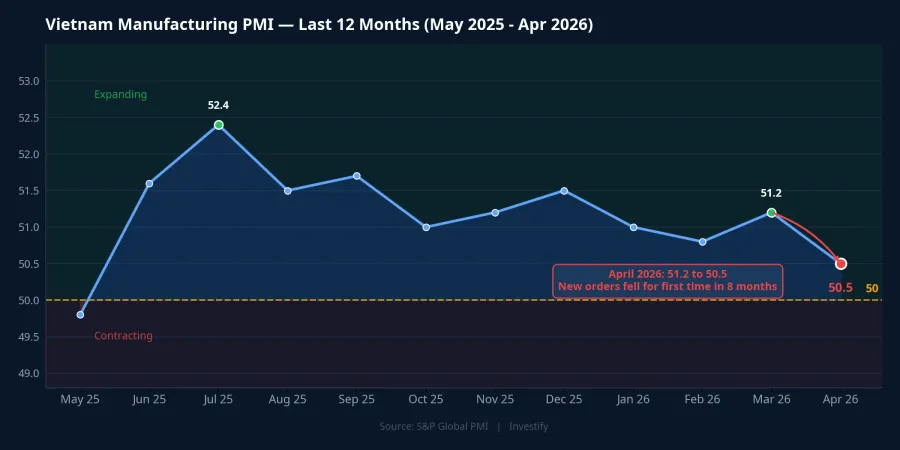
The detail most investors missed in the headline PMI number is the reason new orders fell. S&P Global's report states clearly that both input costs and output prices rose at their fastest pace since April 2011 — the highest in 15 years — driven primarily by fuel, oil, and freight costs.CafeF In plain terms: new orders fell because output prices had to rise to cover input costs, not because end-user demand had disappeared.
Domestic fuel price data confirms this sequence. March through early April was the peak pricing window: RON 95-V gasoline reached VND 34,240 per litre on March 24, while 0.001S-V diesel peaked at VND 44,980 per litre on April 3. By April 29, RON 95-V had retreated to VND 24,650 per litre and diesel to VND 29,430 per litre, down 28% and 35% from their respective peaks. Brent crude closed May 4 at USD 108.83 per barrel, remaining elevated after Hormuz-related tensions throughout April.
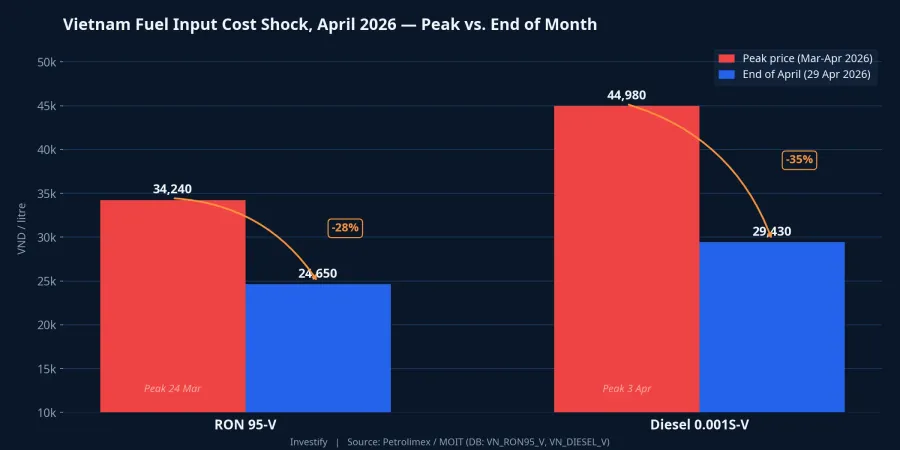
The mechanism works as follows. Manufacturers must incorporate raw material and logistics costs into their quotes. When fuel peaked in the March–early April window, output prices had to rise accordingly. Buyers received new, higher price sheets and delayed orders, waiting for costs to stabilize. April's PMI captured this precisely as "new orders falling." But the root cause was input cost inflation, not a structural retreat in final demand.
Why the Market Rewarded Oil and Gas and Punished Property
Once you understand that PMI weakness was a consequence of high oil prices, the three-way divergence on May 4 lines up cleanly.
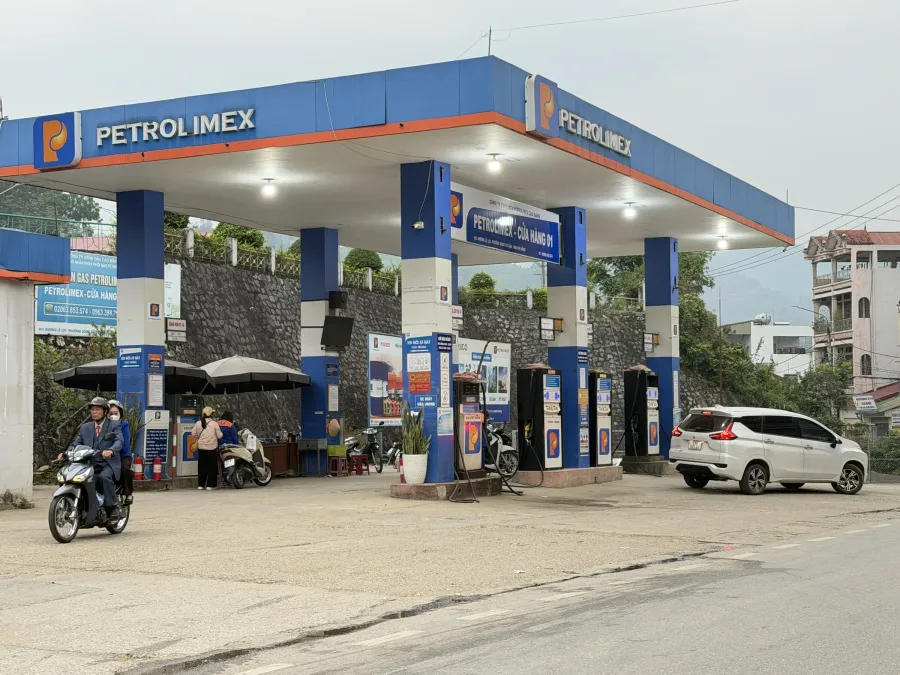
First, oil and gas is the supplier of that input. BSR refines crude into gasoline and diesel; with Brent at USD 108 per barrel, its refining margin is supported by the spread between crude input costs and refined product prices. GAS, PVS, and PVD are linked to upstream exploration and technical services. These projects get activated and sustained when oil holds above USD 100 per barrel. The same variable that pushed PMI down also pushed this group's earnings up: same oil price shock, opposite directional effects.

Second, real estate is the sector most sensitive to real interest rates. Vietnam's CPI for March 2026 came in at 4.65% year-on-year, the highest reading in five years. With manufacturing output prices at their fastest pace in 15 years and CPI already at 4.65%, expectations for April and May inflation could continue to climb. The policy rate has not changed, which means real deposit rates are being compressed, while expectations for mortgage lending rates are unlikely to ease in a rising-inflation environment. Home buyers reading the inflation data defer decisions. Developers face capital costs that are not falling. NVL hitting its daily floor and VIC and VHM both in the red is a rational reflection of that expected environment, not an overreaction.
Third, manufacturing and export names were not sold reflexively. Names like HPG, garment producers, and seafood processors were not treated as if demand had collapsed. The market distinguished between PMI weakness caused by cost-push inflation and PMI weakness caused by structural demand erosion. Export demand through the end of March was still supported by orders bound for the United States ahead of reciprocal tariff deadlines. Underlying demand was intact; what was disrupted was output price stability. The VN-Index holding flat at 1,854 points was not a return-from-holiday non-event. It was the market running three separate calculations simultaneously.
Three Signals to Watch in May
April's PMI alone cannot answer the most important question: was this a one-off shock from holiday disruptions and a fuel price spike, or the beginning of a softer trend? Three upcoming data points will provide the answer.
First, the May PMI, due in early June. Domestic fuel prices have already retreated significantly from their April peaks. If new orders recover as input costs ease, April was a temporary cost-shock reaction. If new orders continue to fall even as costs subside, that is a structural demand signal. Only at that point does the manufacturing and export sector warrant a more serious re-evaluation.
Second, the April CPI, which the General Statistics Office is expected to release this week. March's 4.65% reading preceded the late-March and early-April fuel shock. April will reflect that peak directly. A reading at or above 5% would meaningfully shift how the market prices all rate-sensitive sectors, not just real estate.
Third, Brent's trajectory. The USD 95–110 per barrel range is already priced into current oil and gas equity valuations. A break above USD 115 would trigger another round of input cost pass-through into the May PMI. A drop below USD 90 would reverse the May 4 divergence trade: oil and gas loses its tailwind, inflation pressure eases, and real estate finds a more neutral footing.
The lasting insight from May 4 is not the PMI number itself. It is the discipline of reading why PMI moved. A weakening PMI is not automatically a sell signal for manufacturing stocks. When the cause is cost-push driven by oil prices, the correct sector mapping is: upstream oil and gas benefits, rate-sensitive sectors come under pressure, and manufacturing and export names require stock-by-stock analysis based on cost structure and end-market exposure. The April CPI and the May PMI will confirm or challenge this framework.