


On the first Monday after the April 30 holiday, millions of retail investors reopened their trading apps and asked the same question: VN-Index had recovered to 1,854.10 points by April 29, gaining nearly 180 points over the month — so why does my account still show a loss?
That question has a clear mathematical answer, requiring no emotional reasoning or market speculation. Three structural mechanisms were running in parallel throughout April, and each one is measurable. When you look at the numbers, the picture becomes much clearer.
One Month, Two Markets
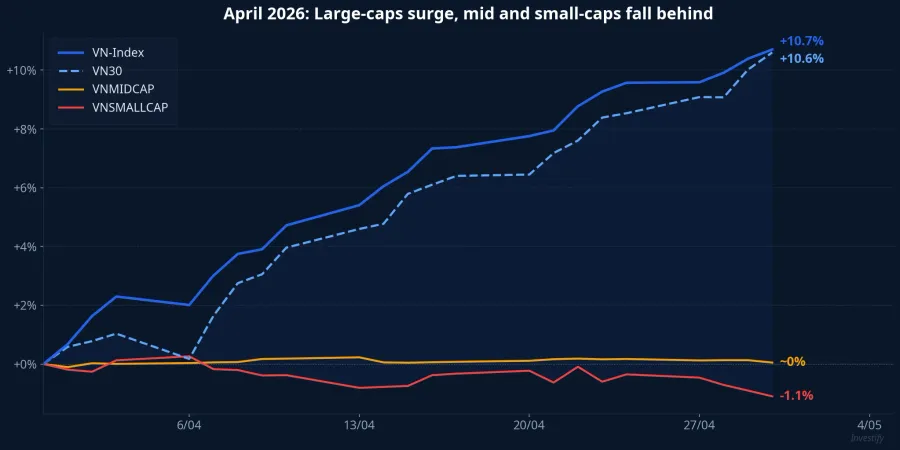
The April data opens with a stark contrast. VN-Index closed the final session before the holiday at 1,854.10 points, up 179.61 points from 1,674.49 at end-March, a 10.7% gain. VN30 moved in tandem, rising from 1,829.59 to 2,022.75, up 10.6%.
Zoom out to the two smaller-cap indices, however, and the picture reverses entirely. VNMIDCAP was essentially flat, closing April at 2,194.26 versus 2,195.29 at end-March: less than 0.1% movement. VNSMALLCAP fell from 1,422.71 to 1,407.28, a 1.1% decline.
This divergence is the starting point for understanding what happened. When VN-Index rises 10.7% while mid-cap stocks are flat and small-cap stocks are down, the "strong rally" is not a broad-based gain. The majority of stocks simply weren't invited on that ride.
Mechanism 1: Margin Liquidation at the Q1 Bottom
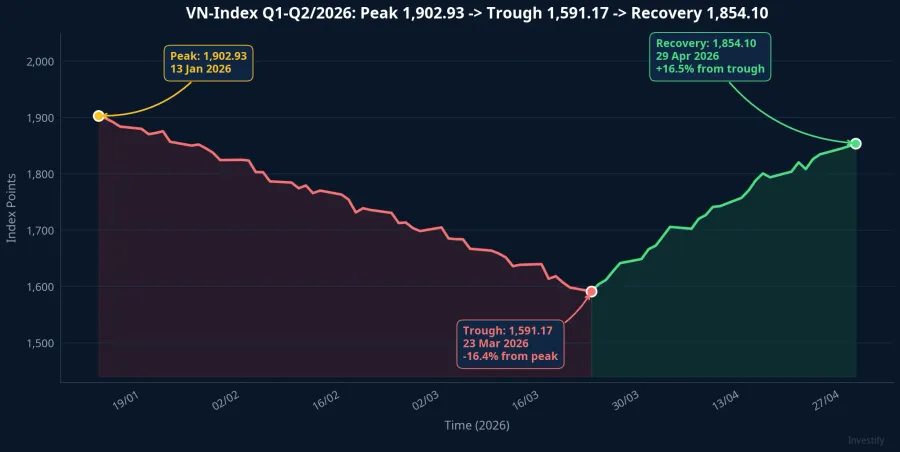
To understand why many retail portfolios missed the April recovery, you have to go back to Q1. VN-Index fell from its peak of 1,902.93 on January 13 down to a trough of 1,591.17 on March 23, a 16.4% decline over more than two months. On March 23 alone, the index dropped 3.44% with 279 stocks declining against just 31 advancing: a textbook panic selloff session.
What amplified the pain was the scale of leverage already in the system. Total margin lending across the brokerage industry reached approximately VND 405,000 billion at the end of Q1/2026, with overall securities lending at approximately VND 415,000 billion; both figures were all-time highs in the market's history.CafeF Five brokerages had outstanding loans exceeding USD 1 billion: TCBS, SSI, VPBankS, VPS, and HSC.
As VN-Index fell to the 1,591-point zone, automated margin call and forced-selling systems across brokerages triggered simultaneously. Investors who had taken on heavy margin positions at January-February price levels were forced to sell at the very bottom. Simultaneously, HoSE removed margin eligibility from 74 stocks effective April 1, including high-liquidity names such as NVL, HVN, BCG, and MCH.CafeF That decision stripped an additional layer of leverage from those stocks.
The consequence: when April's recovery arrived, a significant portion of retail investors no longer held positions to benefit from it. They were sitting on the sidelines during exactly the rally they had been waiting for all quarter.
Mechanism 2: A Rally Concentrated in a Very Narrow Group
The second mechanism compounded the damage from the first. April was not a broad-based rally. It was a rally driven by a small cluster of outsized stocks.
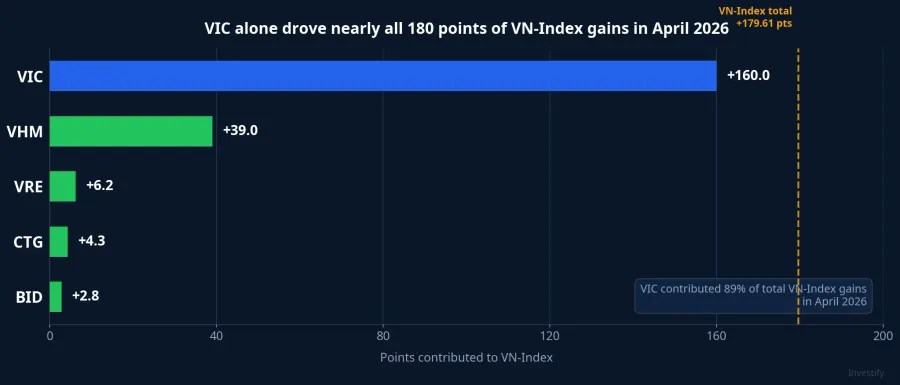
Looking at the point contribution data: in April, VIC surged nearly 60%, VHM gained 42%, and VRE rose 25%.Nguoi Quan Sat VIC alone contributed over 160 points to VN-Index, nearly equivalent to the entire 179.61-point gain for the month. Adding VHM, VRE, and a handful of large-cap banks, almost all of April's index gains came from fewer than 10 stocks.
Why did VIC and the Vingroup complex surge so strongly in April? Available data records the magnitude but does not establish a single definitive cause. The move likely reflected a combination of foreign fund flows, expectations around Vingroup's renewed activity, and index-tracking pressure from domestic funds. Whatever the underlying drivers, the measurable impact is unambiguous: anyone who did not hold the Vingroup cluster in April almost certainly underperformed the headline index.
Mechanism 3: Retail Portfolios Skewed Toward Mid and Small-Cap
The third mechanism is about portfolio structure. Retail investors — particularly those newer to the market — tend naturally to avoid large-cap stocks.
The practical reason is straightforward. With VIC trading around VND 214,000 per share, a minimum 100-share lot costs more than VND 21 million, which exceeds the budget of many smaller portfolios. The high-growth narratives tend to live in mid and small-cap territory, where share prices are lower and the dream of doubling or tripling capital feels more accessible. There is nothing wrong with this preference in principle, but it created a specific consequence in April: a portfolio weighted toward mid and small-cap stocks would have delivered performance closer to VNMIDCAP (~0%) or VNSMALLCAP (-1.1%) than to VN-Index (+10.7%).
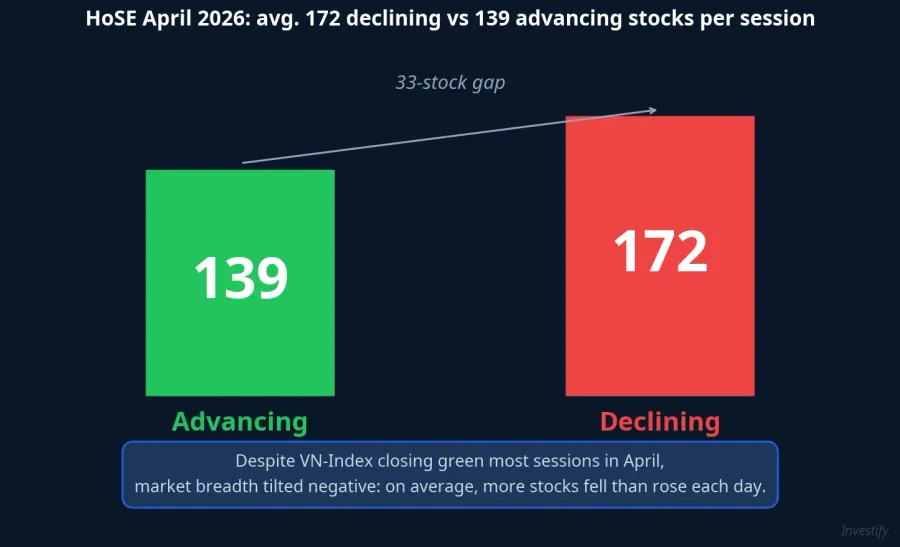
Market breadth data confirms this picture. On average each session in April, HoSE recorded approximately 172 declining stocks against 139 advancing ones. Declining sessions outnumbered advancing ones 12 to 8. Even on the green days when VN-Index closed higher, the majority of individual stocks were still falling. A randomly assembled 10-stock portfolio from HoSE in April had a higher probability of holding red stocks than green ones, regardless of what the headline index showed.
Signals to Watch in May
The three mechanisms together give a complete arithmetic explanation for the paradox: margin liquidation at the March trough wiped out positions, the recovery concentrated in the group investors weren't holding, and the group they were holding was essentially flat or down. No mystery required — just structure.
Looking ahead to May, the most significant variable is Q1 earnings season. As company results are released over the coming weeks, the market will have the data to distinguish genuine capital rotation from an isolated large-cap rally. If Q1 financials from mid and small-cap companies show positive results, capital flows may begin rotating toward that group. History suggests that large-cap-led rallies are often followed by rotation into mid-caps once large-cap valuations stretch. That is a condition worth monitoring, not a certainty.
The key questions May data needs to answer: Can VN-Index hold the 1,877–1,900 resistance zone as Q1 earnings flow in? Will mid and small-cap stocks begin closing the performance gap versus the headline index? These are the signals that distinguish a genuine broad-based recovery from a one-off month of concentrated large-cap gains.