


April 2026 closed with a picture that does not often emerge: Wall Street posted a strong monthly gain while the same night — April 30 in U.S. time — the Bureau of Economic Analysis (BEA) reported slower-than-expected GDP growth and rising core inflation. Apple added one more record quarter right at the final hour of the month. These two data streams do not contradict each other. They describe two different layers of the same economy and explain why stock indices can rise sharply even when macro data is losing steam. For Vietnamese investors holding portfolios through a five-day holiday ahead of the May 5 session, the big picture here is worth reading carefully.
Apple Q2 FY2026: strongest March quarter in company history
Apple reported second-quarter fiscal 2026 results on the night of April 30, with revenue of USD 111.2 billion, up 17% year-over-year.CNBC That makes it the company's strongest March-ending quarter on record. Net profit came in at USD 29.6 billion, or USD 2.01 per share.MacRumors
iPhone and Services led the beat. iPhone revenue reached USD 57.99 billion, up 22% year-over-year, also a record for a March-ending quarter.CNBC The Services segment hit USD 31 billion, setting a new quarterly record.Variety On the earnings call, Tim Cook, CEO of Apple Inc., said the iPhone 17 is "the most popular iPhone lineup in history" and that revenue had exceeded initial guidance "despite supply constraints".CNBC
This was also Cook's final earnings call as CEO. According to Apple's announcement, he will transition to the role of Executive Chairman on September 1, 2026, handing the CEO title to John Ternus, currently Senior Vice President of Hardware Engineering at Apple Inc.Apple Newsroom
Wall Street closes April firmly in the green
The S&P 500 ended the month at 7,209.03 points, up 9.64% from the start of April. The Nasdaq Composite closed at 24,892.3 points, gaining 13.97% over the month. Both indices were led higher by large-cap technology and semiconductor names.
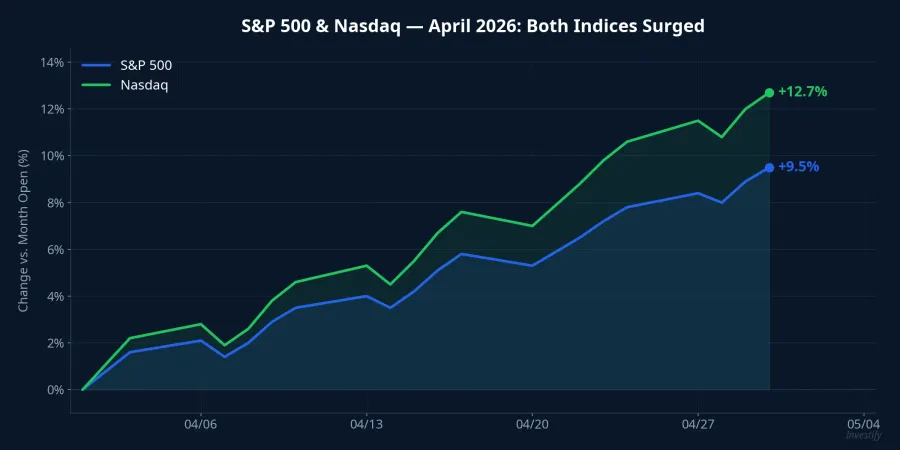
The VIX — the market's gauge of implied volatility — fell from above 24 at the start of the month to 16.89 by month-end, a decline of roughly 31%. A VIX below 17 typically signals that investors see the probability of a large market swing over the next 30 days as relatively low. Demand for downside protection eased noticeably compared to the anxious levels seen at the month's open.
The rally was narrow, not broad. The four largest technology companies by market cap — Microsoft, Alphabet, Amazon, and Meta — all reported Q1 results on the night of April 29, with most beating analyst revenue estimates. Apple provided the final confirmation on April 30. When profit is this concentrated in a small group of companies, the headline index can move higher even when the broader economy is not improving uniformly.
U.S. macro: GDP disappoints, core inflation reverses higher
On the same night of April 30, the BEA released two reports that told a different story from Wall Street's mood. U.S. GDP for Q1/2026 (advance estimate) grew at an annualized rate of 2.0%, below the consensus estimate of 2.2%.CNBC Consumer spending, which accounts for roughly 70% of U.S. GDP, rose only 1.6%, with goods spending actually falling 0.1%. The mass-market consumer is clearly slowing down.
At the same time, core PCE inflation for March 2026 rose to 3.2% year-over-year from 3.0% the previous month, the highest reading since November 2023. Core PCE is the Fed's preferred inflation gauge when weighing interest rate decisions. A reading of 3.2% sits well above the 2.0% target and is moving in the wrong direction for FOMC comfort.
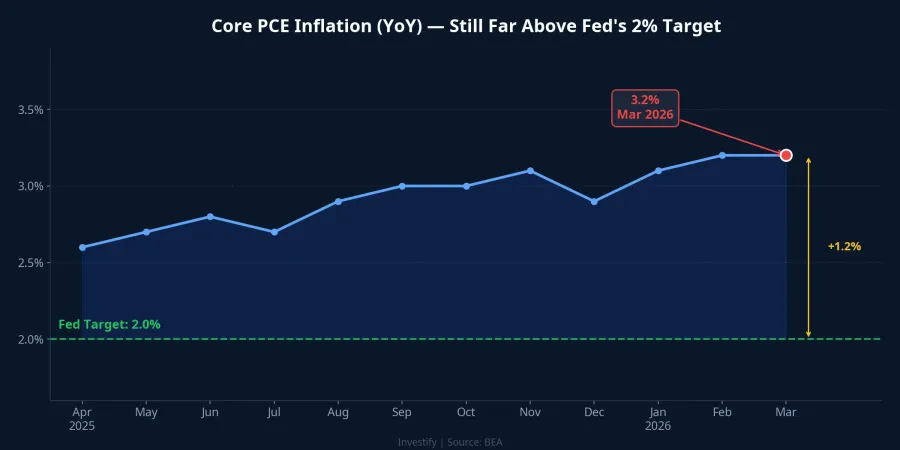
Together, these two figures create an uncomfortable environment for the Fed. Slowing growth would normally open the door to rate cuts, but rising core inflation slams it shut. The most likely scenario for the May 2026 FOMC meeting is holding rates steady while waiting for April labor market data and April price indices before committing to any direction.
Three mechanisms explaining the divergence
The central question is why the index rose sharply while the macro backdrop deteriorated. Three concurrent mechanisms explain the disconnect, and they are not mutually exclusive.
The first is profit concentration. The S&P 500 is increasingly dominated by a group of 7 to 10 mega-cap stocks that carry high profit margins, strong free cash flow, and consistent share buyback programs. A strong Q1 earnings season from this group is sufficient to lift the index even when consumer staples or mass-market retail softens.
The second is consumer stratification. Apple sells iPhones to middle- and high-income customers whose demand is relatively insensitive to changes in everyday living costs. The 0.1% decline in goods spending captures what is happening at the mass-market layer. Both layers coexist. A record result from a premium-segment company does not disprove the weak data from mass-market consumption; it completes the stratified picture.
The third is residual rate-cut expectations. When investors still believe the Fed will cut rates eventually, albeit later than previously expected, growth stock valuations get a valuation lift. A PCE reading of 3.2% may delay the rate-cut schedule, but it has not yet reversed rate-cut expectations entirely. That is why the market held its ground despite deteriorating inflation data.
VN-Index heading into the May 5 session
The VN-Index closed the April 29 session at 1,854.10 points, shedding 21.74 points in the final pre-holiday session. The index sits below its recent short-term high of 1,888.99 and near the 10-day moving average at around 1,841.91 points. Foreign investors sold a net approximately VND 5,570 billion during the final week of April, reflecting in part concerns about the U.S. dollar and Fed policy.
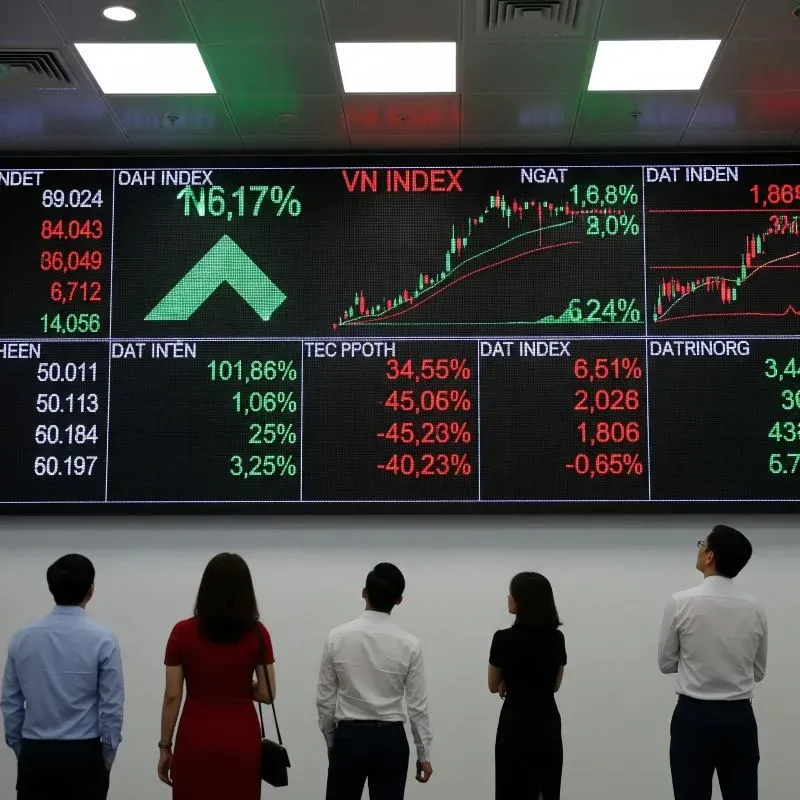
Capital flows are being shaped by two transmission channels from the U.S. picture to Vietnam's market. The first is sentiment: a positive international backdrop — particularly strong earnings from large technology companies — typically supports a better opening session for the VN-Index after a long holiday, when investors return with accumulated information. The second is the exchange rate: if the Fed keeps rates higher for longer in response to sustained PCE pressure, mild USD/VND headwinds could persist and foreign capital may remain cautious. This acts as a drag on large-cap stocks that depend on foreign inflows.
Given the current technical structure, the range many observers see for the May 5 session is 1,840 to 1,870 points. Companies with exposure to the U.S. technology supply chain may attract more attention than exchange-rate-sensitive names.
Key signals to watch in May
The April picture is not a pure bull market. It is a rising market accompanied by deteriorating macro fundamentals. Three signals will determine whether this divergence structure continues.
First, the May FOMC meeting: the base case is no change, but a surprise in either direction — tighter or easier — would significantly reprice growth stocks. Second, the April non-farm payrolls report, expected early in May: a rapid cooling in labor markets would reinforce the case for an earlier rate cut, while strong data would sustain the higher-for-longer narrative. Third, April CPI: if the upward trend in PCE continues, growth stock valuations must accept a higher discount rate for longer, and correction pressure will build.
The bull case rests on continued earnings momentum from mega-cap names and intact rate-cut expectations. The bear case rests on PCE staying elevated and mass-market consumer spending continuing to stall. The decisive factor for May's direction is the April labor and price data.