

Every trade on the Vietnamese stock market generates a commission for a securities firm. Yet in Q1 2026, 21 out of 82 licensed securities companies still reported net losses, despite healthy trading volumes across the exchange.Vietstock Industry-wide net profit reached VND 7.659 trillion for the quarter, up 21% year-on-year but down 22% from Q4 2025 and the lowest quarterly figure in four consecutive quarters.Tuổi Trẻ
The question retail investors rarely ask: how does a securities firm lose money in a quarter when it collects fees on every single order? The answer lies in the revenue structure. Brokerage commissions are not the largest income source at most firms, and the actual dominant revenue stream moves with the index, not with trading volume.
Four Revenue Streams, One That Controls the Outcome
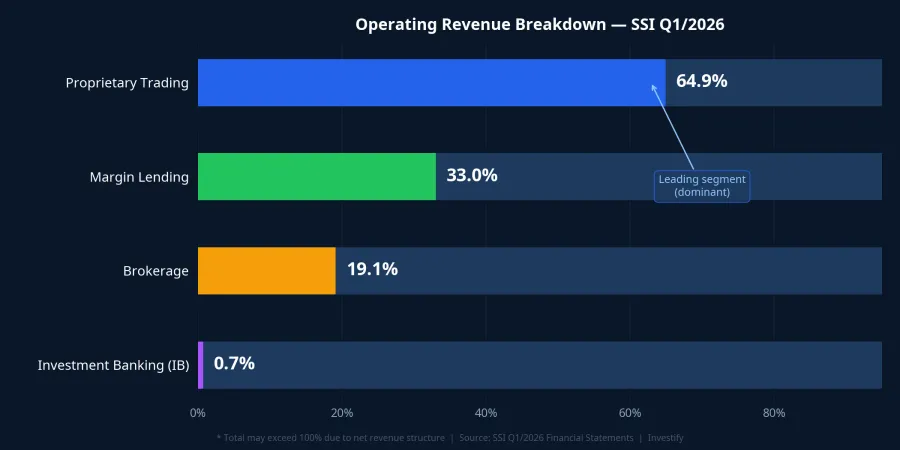
A Vietnamese securities company's operating revenue comes from four sources: brokerage commissions, margin lending interest, proprietary trading (the firm investing its own capital), and investment banking advisory fees. Of these, three dominate, but one is decisive. Look at SSI's Q1 2026 revenue mix: proprietary trading accounted for 64.9% of operating revenue, nearly double margin lending (33.0%) and more than triple brokerage (19.1%). This is not an outlier: VCI reported proprietary trading at 71.6% of operating revenue; EVS at 59.9%.
Brokerage commissions are structurally stable, but years of fierce competition have compressed rates to thin margins. Margin lending interest is also relatively predictable as outstanding loan balances across the industry remain elevated. Together these two streams form a profit floor, but one that cannot absorb a major reversal in the third stream.
FVTPL: Why Unrealized Losses Hit the Income Statement Immediately
Most securities firms classify their proprietary trading portfolios under FVTPL, assets measured at fair value through profit or loss. This accounting standard is the mechanism that drove Q1 2026 results across the sector.
Under FVTPL, every change in market price, even without selling a single share, flows directly into the current quarter's profit or loss. At quarter-end, accountants compare the portfolio's market value against its cost basis: any decline creates a mark-to-market loss charge; any appreciation creates a gain. These adjustments can reach hundreds of billions of dong in a single quarter, entirely independent of how many buy or sell orders were actually executed.
The practical implication: when VN-Index drops sharply mid-quarter, proprietary portfolios record losses in real time. If markets recover before the books close, some losses are reversed. If recovery comes too late, the full mark-to-market loss lands on the quarterly income statement, even if the index bounces strongly in the following quarter.
Q1 2026: A Worst-Case Timing Configuration
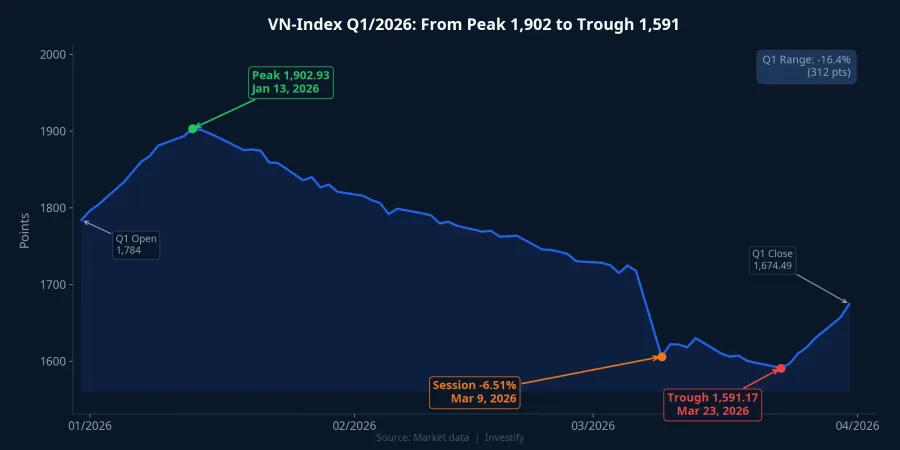
VN-Index opened Q1 2026 around 1,784 points, climbed to a peak of 1,902.93 on January 13, then reversed. On March 9, the index fell 6.51% in a single session, pushing it from around 1,718 down to approximately 1,606. The quarterly trough hit 1,591.17 on March 23, representing a 16.38% drawdown from the January peak.
The accounting calendar made this particularly painful. The Q1 book-closing date was March 31, when VN-Index had only partially recovered to 1,674.49, still 6.16% below the quarter's opening level and roughly one-quarter of the way back from trough to peak. The full mark-to-market loss was booked into Q1 results, even though the index recovered sharply in April. By April 28, VN-Index had reached 1,875.84, just 1.4% below the January peak. The Q1 income statements captured the pain without the recovery.
EVS: A Case Study in Buying the Dip Too Early
Everest Securities (EVS) illustrates the timing trap in concrete terms. EVS reported a net loss of VND 157.5 billion in Q1 2026, reversing from a VND 17.9 billion profit in the same period last year.Fili Breaking down the loss: operating revenue collapsed to just over VND 8 billion, down 91% year-on-year, as mark-to-market loss charges surged from VND 34 billion to over VND 182 billion. Total proprietary trading losses are estimated at approximately VND 180 billion, a complete reversal from a VND 38 billion gain in the year-ago quarter.VietnamBiz
The most telling detail is on the balance sheet: EVS's FVTPL portfolio stood at approximately VND 1,335 billion at March 31, 2026, up 46% from approximately VND 914 billion at the start of the year.VietnamFinance The firm had been buying as prices fell, a classic "buying the dip" approach, but misjudged the timing. The additions were made before the March 23 trough, leaving the firm with losses not just on its existing positions but also on the newly accumulated ones.
Why SSI, HCM, and VCI Stayed Profitable
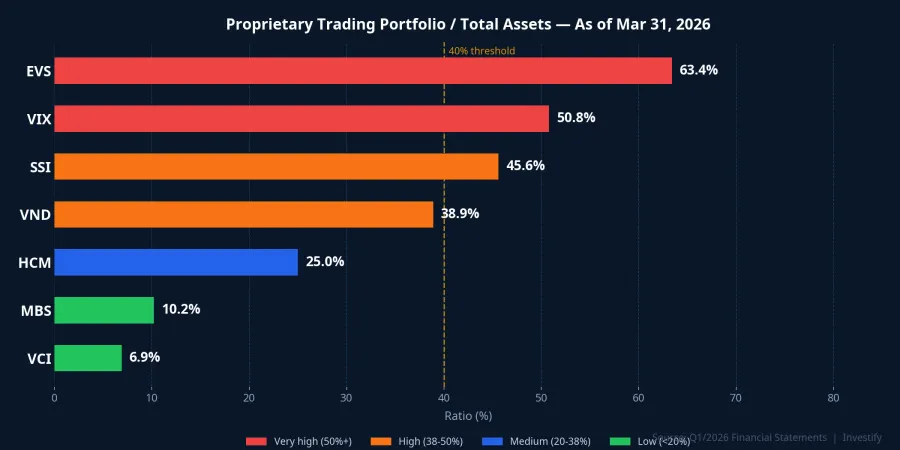
Proprietary trading as a percentage of total assets cleanly separates the winners from the losers in Q1. The high-exposure group: EVS at 63.4%, VIX at 50.8%, SSI at 45.6%, VND at 38.9%. The conservative group: HCM at 25.0%, MBS at 10.2%, VCI at 6.9%.
VCI, MBS and HCM survived profitably because a 16% index drawdown only impacted a small portion of total assets; margin lending and brokerage income was sufficient to offset mark-to-market losses on their modest portfolios. SSI and VND faced heavier pressure but maintained positive earnings through a combination of scale, diversified portfolio construction across tickers and maturities, and a meaningful income floor from margin lending. VIX posted its weakest quarterly profit in five quarters, again attributable to proprietary trading exposure,Vietstock but avoided outright losses due to sufficient scale. The actual losses were concentrated among mid-size and smaller firms: APS, ART, SBS, CVS, CSI, VISECO, companies with smaller capital bases, concentrated portfolios, and limited margin lending to cushion the blow.
One broader observation: even VCBS — the securities subsidiary of Vietcombank — reported a 21% decline in Q1 net profit, attributing it to higher funding costs.Vietstock When macro conditions deteriorate simultaneously, all three major revenue streams (brokerage, margin, and proprietary trading) can face pressure at the same time. No firm is fully insulated.
Q2 2026: Low Base, Potential for Reversal
With VN-Index closing at 1,875.84 on April 28, more than 12% above the March 23 trough, proprietary portfolios enter Q2 in a much more favorable position. The comparison base is the Q1 closing level of 1,674, not the January peak of 1,902. If the index holds current levels through June 30, proprietary trading desks will book substantial mark-to-market gains that reverse a large portion of Q1 losses.
The risk that remains is the same mechanism that created Q1 outcomes: FVTPL cuts both ways. Any shock sufficient to push VN-Index back toward 1,600, whether from US-China trade escalation, geopolitical disruption, or an internal market correction, would create a similar pattern. Data points worth tracking through Q2: foreign investor flow trends, global risk appetite, and specific portfolio disclosures when Q2 financial statements are released.
The Single Metric That Matters
The practical takeaway for reading securities firm financials: proprietary trading portfolio as a percentage of total assets is the most sensitive indicator of index exposure. A ratio above 40% means the firm's quarterly profit will move substantially with VN-Index — not with client trading volumes. A ratio below 20%, as seen at VCI and MBS, reflects a business model with structural insulation during volatile quarters.
Q1 2026 results are the product of a specific adverse configuration: a deep mid-quarter drawdown combined with a book-closing date that arrived before the recovery. This is not evidence of structural weakness across the securities industry. The question for Q2 is whether the financial statements confirm what the index already implies, a strong reversal, or whether a new macro variable interrupts the recovery narrative before June 30.