

The Gap in the Numbers
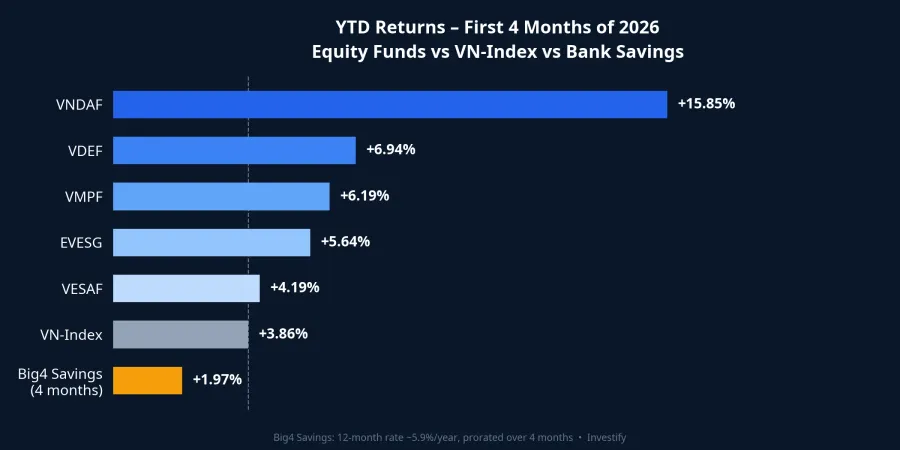
The data tells a clear story: over the first four months of 2026, VNDAF — managed by IPA Partner — returned 15.85%, compared with a 3.86% gain for the VN-Index over the same period. That 12 percentage point gap between the top-performing fund and the broader index did not come from some proprietary stock-picking formula. It came from portfolio structure.
NAV data as of April 24, 2026 puts the five leading equity funds at VNDAF (15.85%), VinaCapital's VDEF (6.94%), VinaCapital's VMPF (6.19%), Eastspring Vietnam's EVESG (5.64%) and VinaCapital's VESAF (4.19%).VnEconomy The VN-Index closed April 24 at 1,853.29 points versus 1,784.49 at end-2025, a gain of 3.86%. The real question is not why the leader won big, but what mechanism produced such a wide dispersion among funds operating in the same market.
Internal Leverage: The Math of Concentration
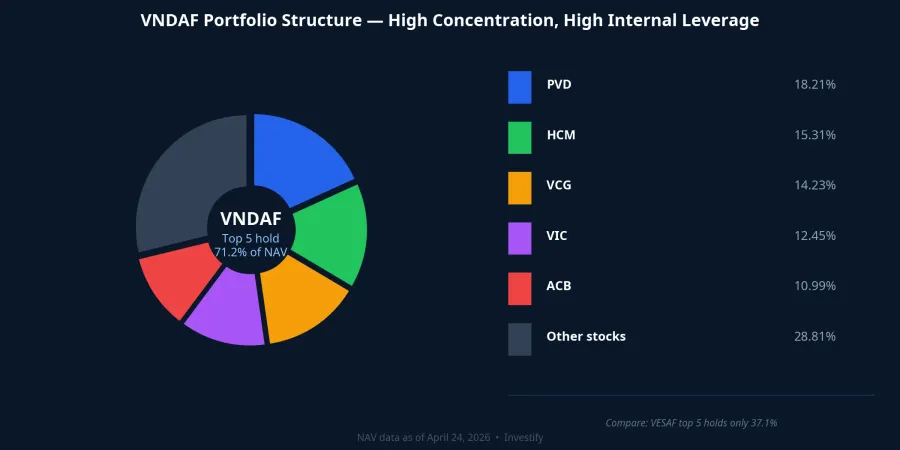
The performance gap is not a talent gap. It is a concentration gap. VNDAF's top five holdings — PVD (18.21%), HCM (15.31%), VCG (14.23%), VIC (12.45%) and ACB (10.99%) — account for 71.2% of total fund assets. Compare that with VESAF, which manages more than eight times the assets (VND 2,529 billion vs VND 300.5 billion): its top five holdings represent only 37.1% of assets, spread across DGC, MBB, BVH, PNJ and HPG.
The internal leverage mechanism works through straightforward math. When PVD gains strongly on the back of an oil and gas recovery cycle, an 18.21% weight in VNDAF amplifies that contribution to total returns proportionally. A diversified fund holding 30–40 names at 2–3% each cannot capture that amplification, even if it holds the same stock. The performance edge does not come from buying better stocks — it comes from sizing them more aggressively.
For individual investors, the intuition is direct: a 30-stock portfolio weighted at 3% each, with one name rising 50%, adds only 1.5 percentage points to the total. A 6-stock portfolio weighted at 15% each, with the same name rising 50%, adds 7.5 percentage points. This is not a secret — it is arithmetic. And it is the same arithmetic that drives the downside when a core holding falls.
March: The Cost of Concentration
The trade-off of concentration never shows up on the upside. It appears when the market reverses.
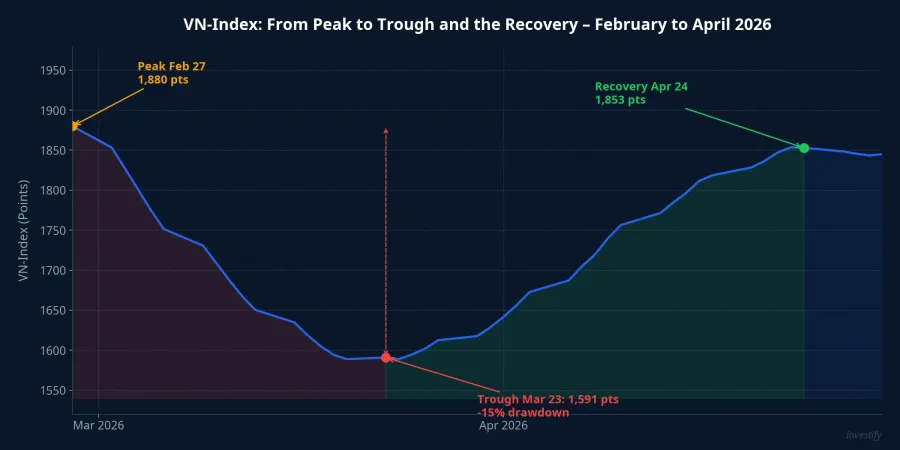
Between late February and late March 2026, the VN-Index fell from roughly 1,880 points (February 27) to a trough of 1,591 points (March 23) — a decline of approximately 15%. On March 9 alone, the index shed 6.51% in a single session. Notably, all 82 Vietnamese equity funds recorded negative performance in March — none escaped the drawdown.VnEconomy Concentrated funds were not immune; with fewer holdings, each core position's correction hit NAV harder.
VNDAF's 15.85% YTD return belongs to investors who held through the full four months, including the March decline. An investor who bought at the start of March and panic-sold at the end of March would have locked in losses at the trough — and missed the entire April recovery.
VND 14 Trillion Redeemed: Who Missed the Rebound
The data confirms exactly that dynamic: Vietnamese equity funds saw net outflows exceeding VND 14 trillion in Q1 2026.VnEconomy Most retail investors chose to take profits or cut losses during the volatility of February and March — redeeming precisely when the market was finding its floor. The rally from 1,591 to 1,853 points across April belongs exclusively to those who stayed.
This is the critical insight when evaluating concentrated funds: their strong returns come with the implicit requirement that investors maintain discipline through drawdowns. Without that discipline, the YTD figure on a fund factsheet translates into a realized loss in the account.
Leadvisors and VSC: A VND 1,444 Billion Single-Name Bet
On April 22, 2026, Leadvisors purchased approximately 60 million shares of VSC (Viconship) through a block trade worth around VND 1,444 billion, raising its stake to 16.03% and becoming a major shareholder in the logistics company.CafeF VSC was trading around VND 22,200 per share at the time — a meaningful discount from its early-March high of VND 27,500.
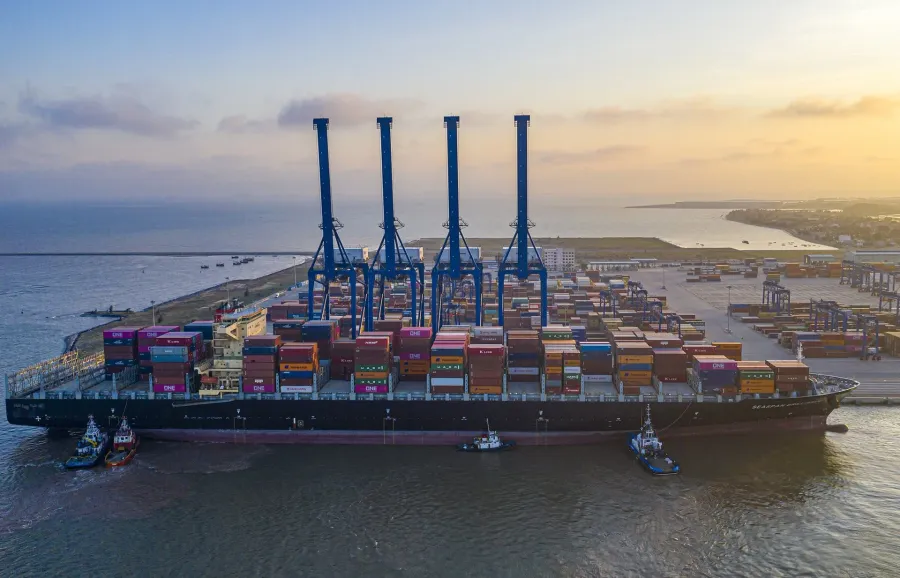
The transaction makes the concentrated-bet framework concrete. Leadvisors committed approximately VND 1,444 billion to a single name, at a post-correction price, around a specific thesis: VSC is developing a deep-water terminal, management targets roughly 10% profit growth in 2026, and the logistics sector stands to recover alongside export activity. If the thesis holds, a 16.03% ownership stake gives the fund meaningful influence over corporate governance. If it doesn't, the loss scales with the position size.
This is not a template for individual investors to follow directly. Deploying VND 1,444 billion into one stock requires a deep research process, tolerance for large NAV swings and a sufficiently long investment horizon. Professional funds can do this because they have all three. An individual investor attempting the equivalent — say, concentrating 50% of their portfolio in a single name — faces asymmetric risk without the offsetting edge.
FTSE Upgrade: An Additional Layer, Not a Replacement
FTSE Russell is expected to formally upgrade Vietnam to Secondary Emerging Market status in September 2026. Passive inflows are estimated at approximately USD 1–2 billion according to SSI Research and the State Securities Commission.VnEconomy
These passive flows will be allocated by market-cap weight into FTSE-tracking ETFs, not by active selection. That creates structural demand for large-cap names (VIC, VHM, HPG, VCB and others) and a long-term tailwind for the VN-Index. At the same time, it introduces a new reference point for measuring active fund performance. Concentrated funds like VNDAF may continue to outperform the index by positioning in names outside the FTSE basket, but they also face the risk of missing the rally in large-caps driven by passive inflows. These are two opposing effects that need to be understood before making any allocation decision.
A Sensible Allocation Framework
The performance gap in the first four months of 2026 is real — but it did not come free. It is the reward for three simultaneous conditions: accepting a concentrated portfolio, maintaining discipline through the March sell-off, and resisting the wave of Q1 redemptions. Not every investor can satisfy all three at once.
Looking at the data from an allocation perspective, each fund type serves a different role in a multi-asset portfolio. Concentrated active funds like VNDAF fit best as a satellite allocation — a small enough weight to benefit meaningfully if the thesis is right, but not large enough to cause serious damage if it isn't. Broadly diversified large funds such as VESAF or VMPF are better suited as core holdings, given their diversification and superior liquidity profile. Index ETFs will become increasingly important from Q3 2026 onward, as passive FTSE flows create structural demand for large-cap names.
Q1 earnings results from the companies in VNDAF's portfolio and April NAV data will show whether the concentrated theses held by VNDAF and Leadvisors are tracking as expected — these are the signals worth monitoring over the next two weeks.