


Every late April, "Sell in May and go away" resurfaces in investor groups. The logic originates from U.S. markets: equity returns between May and October have historically trailed the November–April half of the year. The implicit assumption is that this pattern transfers to VN-Index, making April's final sessions a time to trim exposure. The big picture tells a considerably different story.
Eight years of data against one market adage
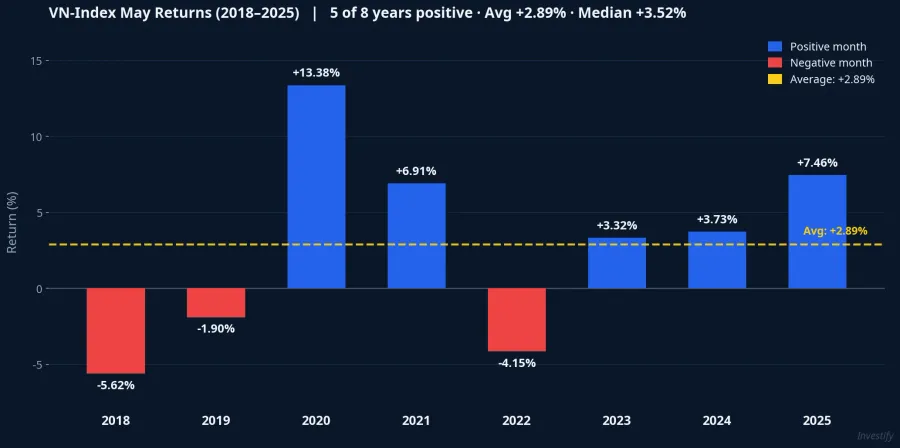
Across 2018–2025, VN-Index posted five positive Mays and three negative ones. The average monthly return was +2.89%, the median +3.52%, with a standard deviation of 6.47%. A variable that is positive on average and positive 5 out of 8 times cannot credibly be called a sell rule.
The liquidity comparison is similarly unimpressive. Average matched-order value in May runs about 4% below the rest of the year, hardly evidence of a "dry-up month." Most of that gap traces to fewer trading sessions because of the April 30–May 1 holiday window, not to any coordinated investor exodus. A small structural quirk inflated into a law. This is how most market myths are born.
Three down Mays: each driven by its own macro shock
The more useful question: did those three negative Mays share a common cause?
May 2018: total return −5.62%, with an intra-month drawdown of −13.2%. The backdrop was Fed tightening in its second year, escalating U.S.–China trade tensions, and a broad emerging-market selloff. VN-Index had peaked at 1,204 points in April 2018 and entered a downtrend that ran through year-end.
May 2022: total return −4.15%, intra-month drawdown −13.87%. The Fed hiked 50 basis points — its largest single move in 22 years. Domestically, confidence in corporate bonds had already cracked after a series of enforcement actions in April. Margin debt was elevated and triggered a wave of forced liquidations that amplified the decline well beyond the macro catalyst alone.
May 2019: return −1.90%, a moderate pullback tied to renewed U.S.–China tariff escalation and broad emerging-market weakness.
All three episodes can be explained by a specific macro driver unrelated to the calendar month. Labeling them "May seasonality" obscures what actually caused the declines. Looking the other direction, VN-Index's worst historical drawdowns were not concentrated in May at all: in 2008 the index shed more than 600 points spread across the entire year, not in any single month.Tin nhanh chứng khoán
The real mechanism: an amplifier, not a risk generator
May in Vietnam has genuine structural characteristics worth understanding.
First, trading sessions are fewer because the April 30–May 1 and Labor Day holidays cut into the opening of the month. Second, an information gap opens between earnings seasons: Q1 reporting peaks in April, Q2 reporting peaks in July. Third, May regularly coincides with a mid-year FOMC meeting and the U.S. Q1 GDP release, among the heaviest macro event weeks of any quarter.
The implication is that when an external shock lands in May, the market digests it more slowly because a cluster of sessions at the start of the month has already been removed by the holiday. The clearest example is May 2022 — margin calls hit during a reduced-session week and the drawdown was wider than the macro catalyst alone would have implied. This is an amplification condition, not a risk generator. May does not produce drawdowns; it transmits shocks that originate elsewhere with greater intensity.
May 2026: the real pressures are macro, not seasonal
Domestic fundamentals are currently supportive. Q1/2026 GDP growth came in at 7.83%Government Portal, the highest first-quarter reading in nine years. The Q1 earnings season is at its peak, with dozens of listed companies reporting after-tax profit growth exceeding 100% year-on-year as of April 26.CafeF This provides genuine fundamental support for the index's large-cap leaders.
However, three external variables for 2026 cannot be overlooked.
March CPI rose 4.65% year-on-year: a five-year high. This reading already exceeds the government's 4.5% full-year target for 2026.CafeF The State Bank of Vietnam's room to ease monetary policy has narrowed considerably compared to the same point in prior years. If oil-driven import price pressures keep CPI elevated through April and May, the central bank will have limited tools available to support the market.
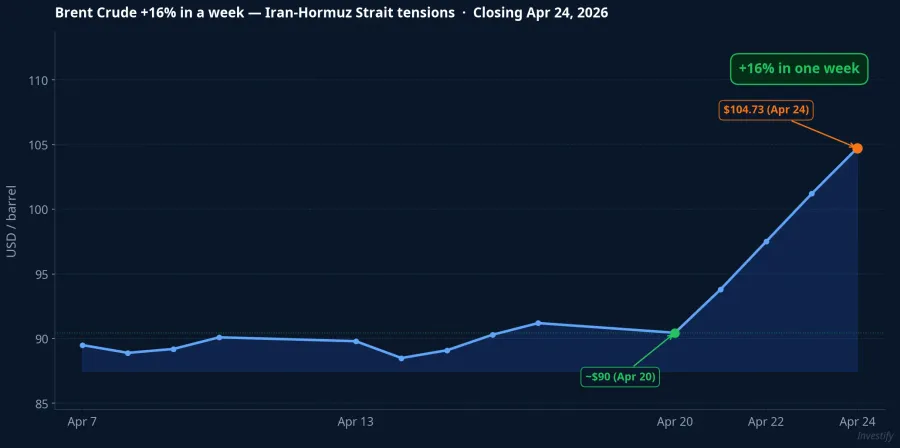
Brent crude closed April 24 at $104.73/barrel, up roughly 16% in a single week. The catalyst was Iran-linked tensions at the Strait of Hormuz. Any further oil price gains feed directly into import-driven CPI. This feedback loop is now activating precisely when domestic inflation is already at a five-year high.
Margin debt has hit a historic peak. By end of Q1/2026, total outstanding margin loans across the securities industry exceeded 405,000 billion VND, setting a new all-time record.Hanoionline A market carrying record leverage is more sensitive to any adverse shock — not because it is May, but because of the current debt structure.
A macro-heavy week falls directly inside the holiday window
There is one calendar detail worth more attention than any seasonal rule. The April FOMC meeting runs April 28–29, the final two sessions VN-Index is open before the holiday. The Fed's rate decision is released at 2:00 p.m. ET on April 29, which translates to the early hours of April 30 in Vietnam, after local markets have already closed and will not reopen until Monday, May 4.
That same week also brings the U.S. Q1 GDP print and peak Big Tech earnings: Microsoft, Meta, Apple, and Amazon. Four consecutive closed days in Vietnam overlap with one of the most event-dense macro weeks of the quarter. The May 4 open will consolidate four days of international market reaction in a single session.
The big picture here is clear: the primary source of uncertainty in the next two weeks is not the month on the calendar — it is the coincidence between a dense macro event schedule and a four-day window where domestic investors cannot react in real time.
Three signals to watch after the holiday
"Sell in May" captures a narrow truth: May has fewer sessions and is more sensitive to external shocks. Eight years of data do not support it as a sell rule. 5 of 8 years positive, average +2.89%. But 2026's specific conditions create enough structural stress that May could be volatile if an external shock materializes: CPI already above target, Brent elevated on geopolitical risk, margin at all-time highs, and the FOMC decision landing during the holiday gap.
Three signals to monitor in the first week after the holiday break:
- Oil price reaction following the FOMC decision: if Brent breaks above $110, the import-driven CPI escalation scenario becomes materially more probable.
- Matched-order volume on May 4: below 600 million shares indicates wait-and-see sentiment; above 900 million signals directional conviction from active money.
- Behavior of large-cap leaders: VHM, VIC, HPG, and TCB serve as the key institutional sentiment indicator in the first session after a four-day closure.