
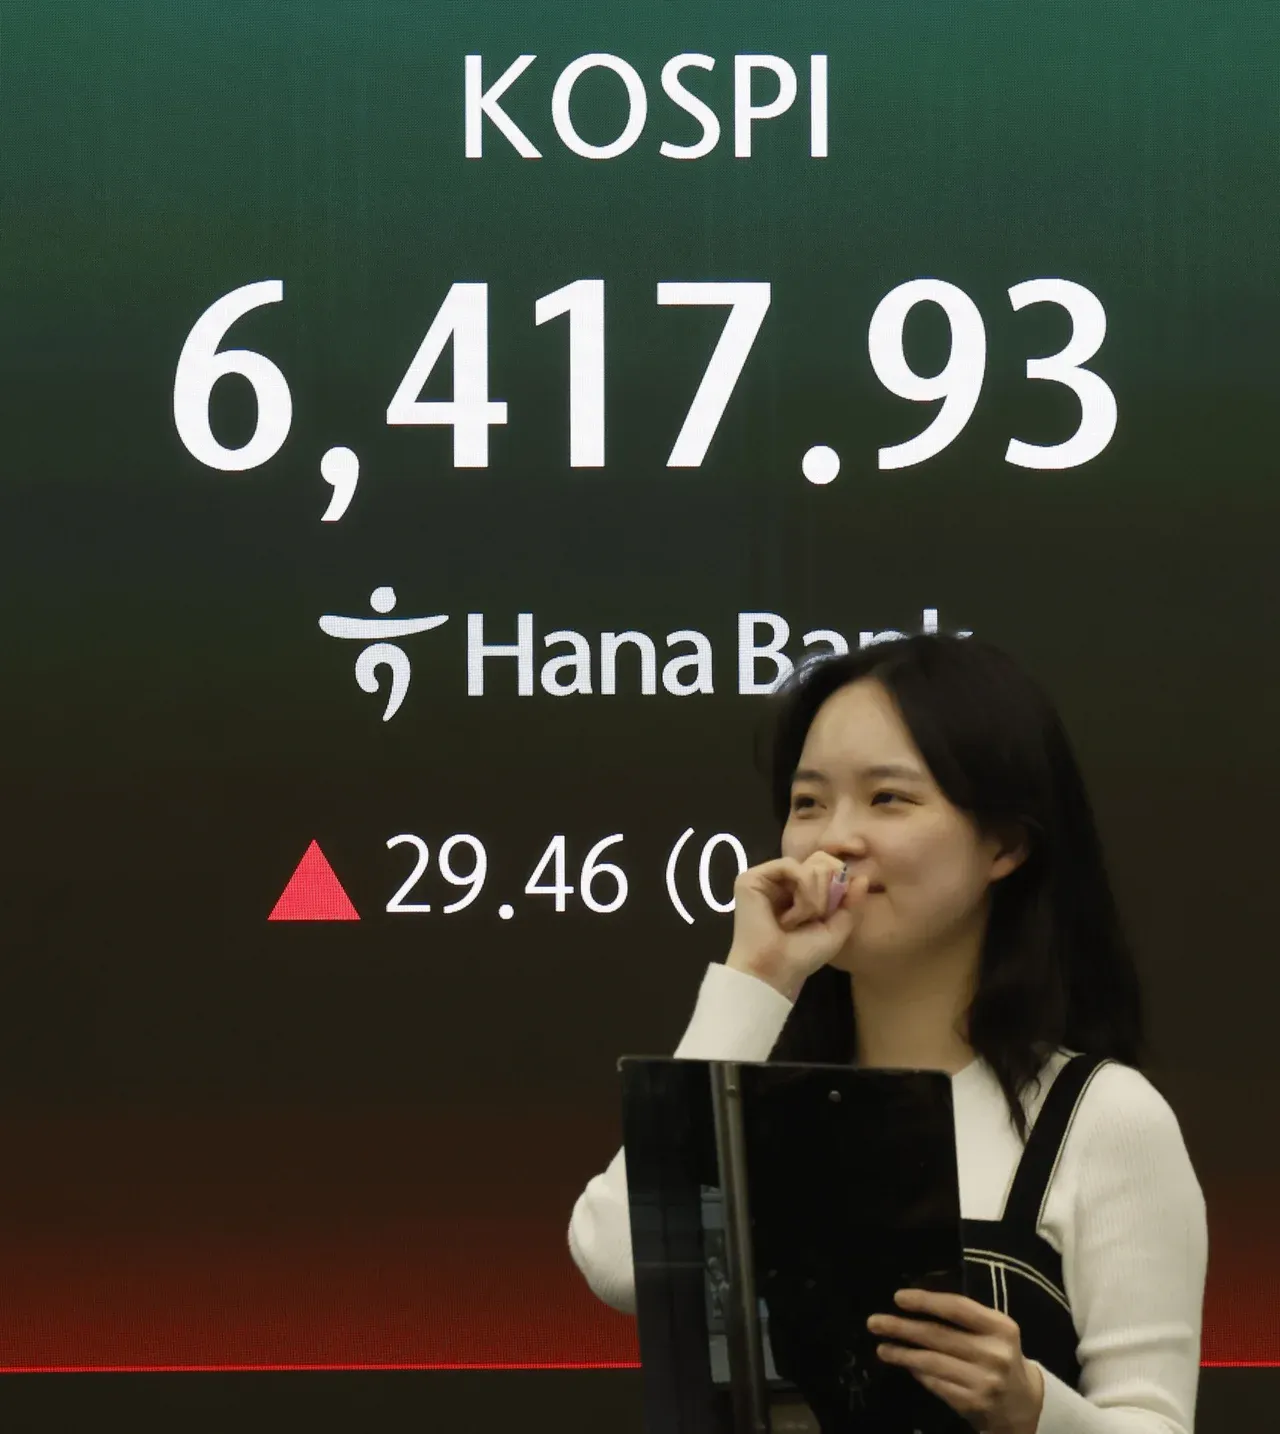

The big picture holds one odd detail. KOSPI closed April 24 near 6,475 points, a day after setting an all-time high of 6,557.76.Korea Herald For all of 2025, the index rose roughly 75%, making Korea the best-performing East Asian equity market. And yet, in just the first two months of 2026, Korean retail investors were the largest net buyers of US equities in the world, snapping up nearly $9 billion — $4.8 billion in January, another $3.9 billion in February.CNBC
If the domestic market is at its peak, why is domestic capital still heading across the Pacific? This is not a crash-avoidance story. It is a 10-year-frame story, and it opens a useful lens for Vietnamese retail investors weighing "stay heavier in the VN-Index" against "start thinking about cross-border diversification".
A 5-point gap per year, compounded over a decade
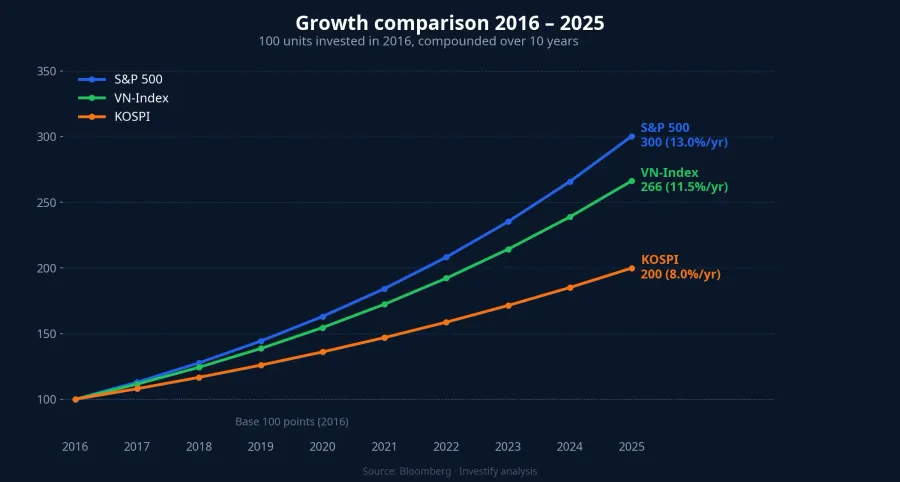
From 2016 to 2025, the S&P 500 delivered an average total return of about 13% per year, dividends included. Over the same stretch, KOSPI managed roughly 8% per year — and that number already includes the 75% surge in 2025. Before 2025, the gap between the two was even wider.
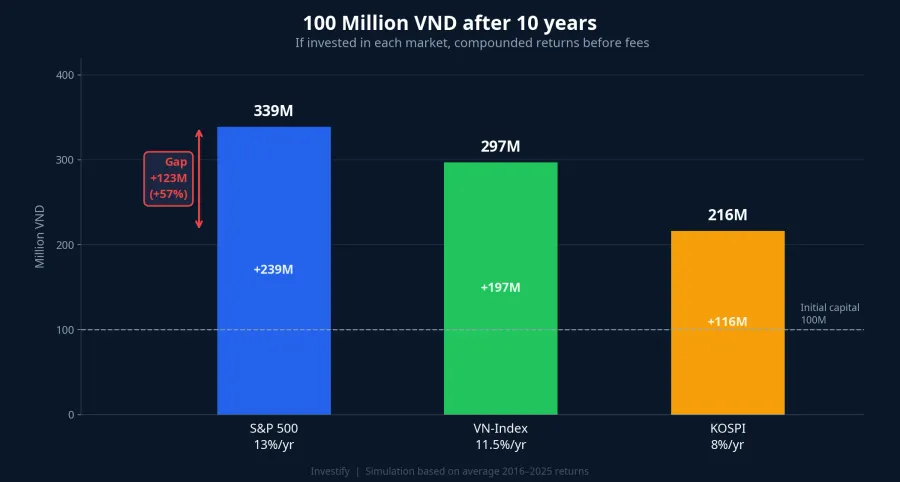
Five percentage points a year does not sound like much. But compounding is additive over time, and the curve of years does not forgive. Put 100 million dong into the S&P 500 and you end 10 years later with 339 million. Put the same amount into KOSPI and you end with 216 million. A gap of 123 million — nearly 57% of the initial capital — vanishes because of what looks like a modest annual spread.
Where does the VN-Index sit in this picture? It closed 2016 at around 672 points, ended 2024 at 1,266.78, and pushed above 1,790 by late October 2025. Roughly priced out over nine years, that is an 11–12% annual price return, excluding dividends. In other words, the VN-Index sits between the two poles — less even than the S&P 500, but ahead of KOSPI, with wider domestic cycles as the trade-off.
The return gap is not the only story. The two indices also differ in the smoothness of the curve. The S&P 500 has fewer correction years and gentler drawdowns, so investors tend to stay invested across the full 10 years. KOSPI runs through wider swings that push retail holders toward selling the trough and buying the top. Compounding breaks apart, and the 8% average becomes harder to actually capture in real accounts.
Tesla, Nvidia, Apple: a vote for the AI cycle
Korean retail investors are not spreading their bets evenly across the US market. Three names dominate their holdings: Tesla at $27.6 billion (about 16% of total US equity assets), Nvidia at $17.9 billion, Apple at $4.3 billion.CNBC These three represent three edges — electric vehicles, AI infrastructure and premium devices — none of which have KOSPI equivalents that match on market cap and margin structure.
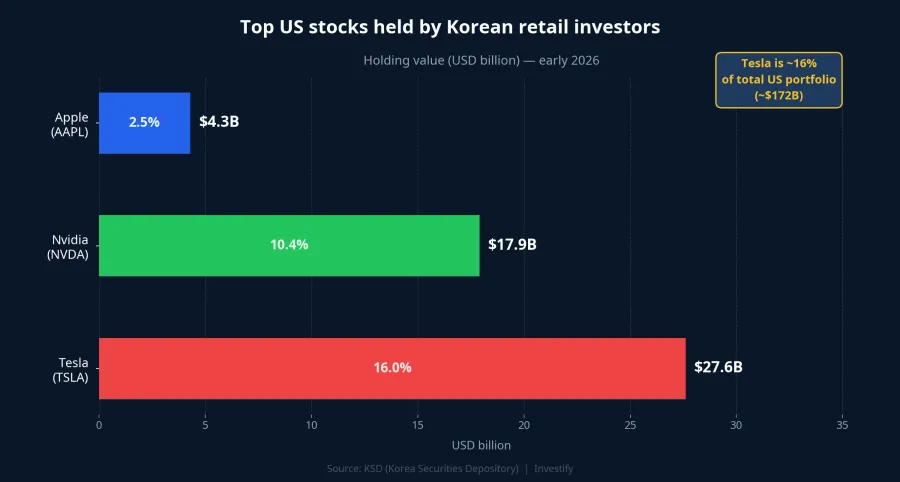
The twist: KOSPI is not short of mega-caps. Samsung Electronics and SK Hynix carry the index, and Korean semiconductors are riding a favourable HBM memory cycle. Yet Korean retail still picks Nvidia over SK Hynix, Tesla over Hyundai, Apple over LG Electronics. This is not a flight from domestic risk — it is a vote of confidence in the margin structure US firms are holding through the AI cycle.
Another way to read it: a KOSPI all-time high should be the very reason to keep capital at home. Instead, the opposite is happening. The wealth effect — domestic assets throwing off gains — is being redeployed into the US, because Korean investors see a 5-point gap per year over 10 years, not the wobble of a single quarter. The $9 billion pace only slowed from March (to $1.5 billion, down 69%) when Middle East tensions flared, not because confidence in KOSPI came back.
Three questions for Vietnamese investors before sending capital abroad
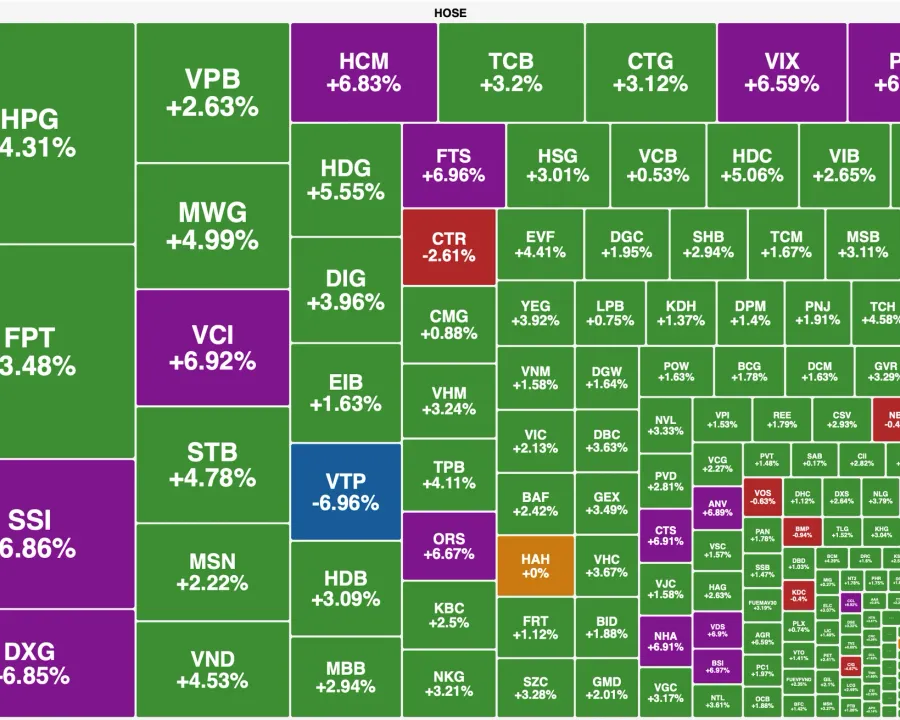
The VN-Index closed April 24 near 1,853 points, after a strong 2025 and ahead of a four-day April 30 holiday. The question "add more to VN while it runs, or start thinking about cross-border diversification" is no longer a luxury one for retail investors. The Korean mirror is not a specific prescription — but the 10-year data across three indices opens a reference frame for three practical questions.
First is the legal frame. Vietnamese retail investors cannot open direct accounts on US exchanges under current foreign exchange rules. The common legal channels are indirect investment through licensed open-end funds, ETFs or products distributed in Vietnam under regulator-approved offshore investment quotas. Any pitch from forex platforms or unlicensed brokers promising "direct US accounts" falls outside what the State Bank has approved — cross it off the list entirely.
Second is a sensible allocation for the first step. For Vietnamese retail investors first touching international assets, the common range sits at 5–15% of total portfolio — enough to feel a different cycle, not so much that it drifts far from the currency of daily spending. Going past that band requires pricing in FX risk, conversion tax costs and a deeper understanding of the foreign market — three variables that can erode the 5-point edge if not reckoned with carefully.
Third is the data to read before deciding. Three minimum numbers: 10-year return of the target index, annual volatility, and total cost (fund management fee + FX spread + tax). The 13% and 8% gap only holds if total costs do not eat the advantage. For Vietnamese open-end funds with international investment licenses, annual total costs typically range 1.5–3%. After fees, the real gap between domestic and international channels can shrink meaningfully — and that is the calculation every investor has to run against their own portfolio.
A 10-year frame, not a single session
The Korean mirror offers one compact lesson. When domestic investors keep exporting capital year after year — even with the home market at records — that is the sign of a long-horizon decision grounded in data, not a short-term flight from a crash.
For Vietnamese investors, the question is not "go or stay", but "what share of the portfolio can live with another market's 10-year curve". A bearish thesis on the VN-Index is not the point — the VN-Index can keep delivering 11–12% and still deserve the bulk of a portfolio. The point is that a small slice sitting on a different return curve, with costs counted properly and a clear legal basis, can smooth the overall path across cycles.
Three numbers worth tracking in the coming months: net inflows into Vietnamese open-end funds with international investment licenses, the USD/VND spread after the April 30 holiday, and how the S&P 500 responds to Q1 earnings from the Mag 7. Those three signals will say whether this 10-year frame is genuinely opening up for Vietnamese retail — and at what cost.