


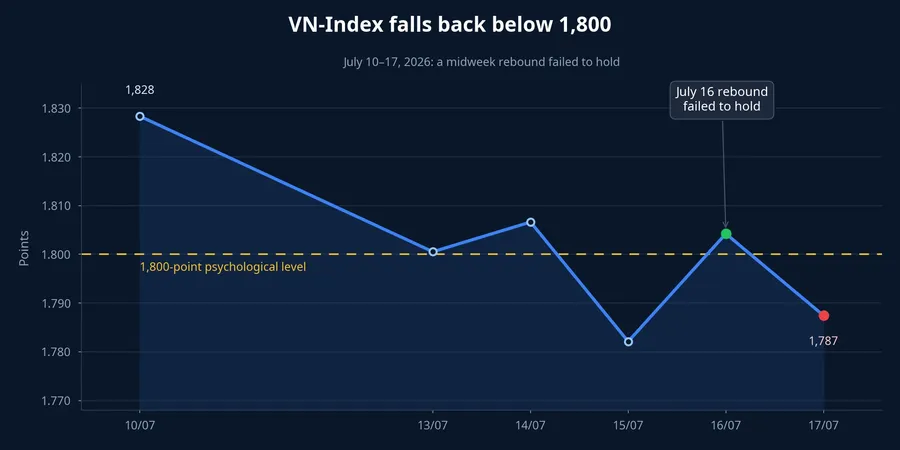
VN-Index ended the July 13-17 week at 1,787.45 points, down 40.89 points or 2.24% from the previous Friday. It was the index’s third consecutive weekly decline.CafeF The useful lesson is not in any single green or red candle. It is in the sequence: an early-week selloff, a sharp midweek rebound, then a failure to retain that gain on Friday.
For new investors, a powerful up session can make the market feel as though it has already changed direction. That reaction is understandable when an index climbs dozens of points from its intraday low. But a bounce only tells us that someone is willing to buy; a recovery needs those buyers to keep showing up across a wider set of stocks.
The weekly path matters more than one session
Monday, July 13, established the cautious backdrop. VN-Index fell 1.52% to 1,800.54, with 50 gainers against 263 losers and more than 845 million shares traded. An index decline, broad losses and heavy volume together suggest that selling was not confined to a few large-cap names.Thời báo Tài chính Việt Nam
On July 14, the index rose 0.34% to 1,806.63. Breadth turned positive, with 185 gainers and 106 losers, but volume was only about 562 million shares, materially below the prior down day. A green session on lighter trading is not inherently negative, yet it does not show that fresh money is ready to carry prices much further.
By July 15, VN-Index had fallen 1.36% to 1,782.12. Losers numbered 229 while gainers numbered only 69. The prior bounce therefore had not become a durable shift in trading behaviour. This is why investors should judge each session within a sequence rather than give a single change of colour too much weight.
What the July 16 reversal did establish
July 16 was the week’s most striking session. VN-Index fell as low as 1,757 before closing at 1,804.24, up 22.12 points. From its intraday low to the close, the index recovered nearly 47 points.SHS VietnamBiz
That move has a clear meaning: lower prices attracted enough demand to absorb supply during the session. It is the first evidence that buyers were not entirely absent. First evidence is not a final conclusion, though. It is closer to an engine starting than proof that the whole journey will be smooth.
Breadth is where that distinction becomes important. At the close, HOSE had 134 gainers and 152 losers, while the VN30 basket had 22 gainers and five losers. VIC and VHM made a major contribution to the index advance. Those facts do not invalidate the rebound, but they indicate that buying was more visible in large caps than across the broader exchange.SHS
Breadth shows whether a rebound is spreading
An index is a composite whose constituents have very different weights. A rising index does not mean that most portfolios or most listed shares are rising. A handful of very large stocks can lift VN-Index while many other names remain weak. For a first-time investor, that is the difference between a healthy-looking index and a healthy market base.
Friday supplied the missing follow-through test. VN-Index fell 16.79 points, or 0.93%, to 1,787.45, while HOSE recorded only 95 gainers against 216 losers.Nhân Dân The index retreated and breadth weakened from the session before it.
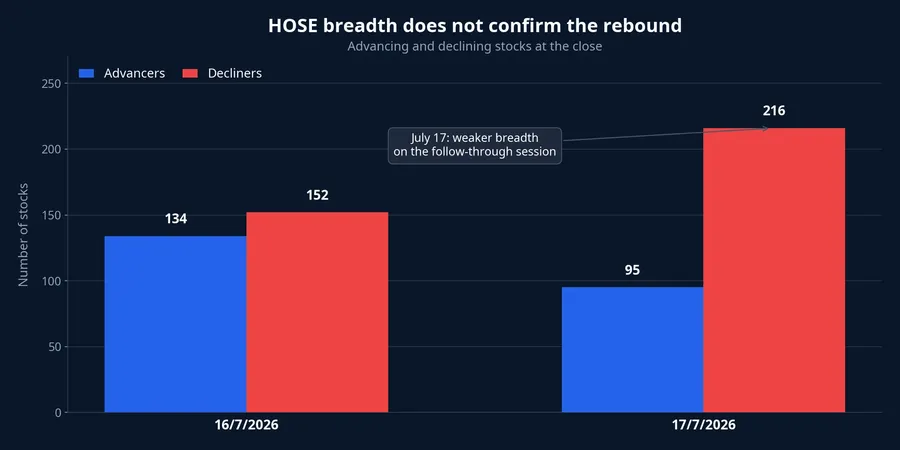
This does not make the July 16 rebound meaningless. It says that demand had not yet spread broadly enough or produced a second day of confirmation. A confirmed recovery usually needs more than leadership from a small group: gainers should progressively take the lead, and advances should remain in place after the intraday excitement fades.
There is an important discipline here for investors who follow an index rather than every constituent. The index is useful for describing the market’s direction, but it is not a substitute for checking the breadth of that move. If a portfolio is concentrated in shares outside the leaders, its experience can differ sharply from the headline index. Looking at both measures helps prevent a strong index print from being mistaken for a broad improvement in risk appetite.
Turnover needs to be read with price action
Turnover is often described as the market’s vote. That is a useful analogy only if we also ask whether money appeared while prices were rising or falling, and whether it stayed present in later sessions. High matched value on a down day can reflect proactive selling. High value during a rebound shows buyers participating, but it cannot by itself prove that they will persist.
On July 17, matched value on HOSE was just above VND 10,524 billion, below the prior session.Nhân Dân The contraction may indicate caution from both buyers and sellers ahead of the weekend. It would therefore be an overreach to treat lower turnover alone as proof that selling had ended, or as proof that the market was certain to weaken further.
A more useful reading combines three pieces: the index direction, breadth and trading activity. When the index rises, gainers dominate and turnover holds up, those signals reinforce one another. When the index rises but breadth remains weak, or its gain disappears the next day, a cautious conclusion is more appropriate.
The same framework also avoids treating any one indicator as a verdict. Breadth may improve before turnover does, while turnover can rise because sellers are active rather than because buyers are confident. What matters is the pattern over several sessions. A reader does not need to predict the next candle to observe whether the evidence is becoming more consistent or more conflicted.
Foreign flows add another layer of information
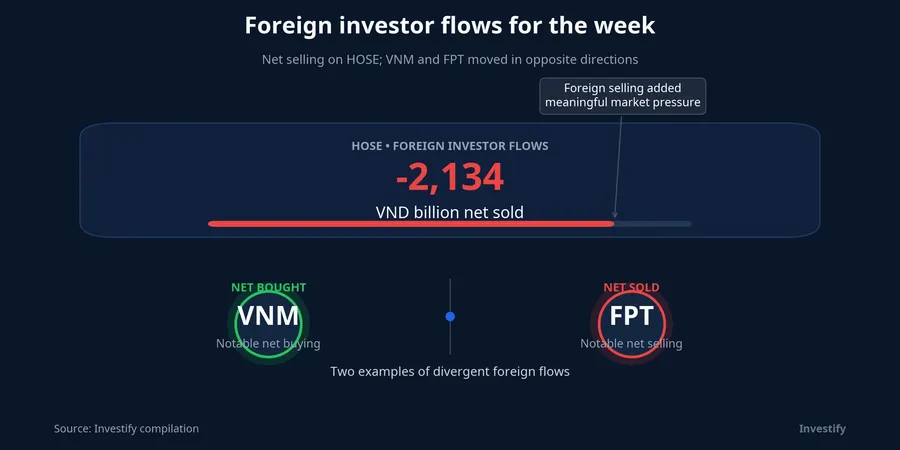
Foreign investors were net sellers of VND 2,134 billion on HOSE for the week.SHS That is a source of pressure worth monitoring, but it should not become the sole explanation for every movement in VN-Index. Domestic supply and demand, index weights and sector-specific trading also matter.
The flow was not uniform. VNM saw VND 328 billion of net buying, while FPT saw VND 606 billion of net selling during the week.CafeF Put simply, “foreign net selling” is a market-wide description, not a verdict on every ticker. Investors should check where a company sits within the flow rather than apply one market label to an entire portfolio.
Conclusion: look for repetition
The thesis from this week is straightforward: buyers emerged at lower prices, but there is not yet enough confirmation of a short-term recovery. July 16 was constructive because it demonstrated demand from bargain hunters. July 17 and the weaker breadth show that the signal still needs further testing.
In the coming sessions, the useful watch list is whether breadth tilts toward gainers, whether turnover holds when the index rises, and whether a green session retains its gain the following day. Foreign flows are supplementary evidence about supply, not a necessary condition for every rebound. A shift in trend will have a firmer basis only when those three pieces improve together.