

On May 29, 2026, Vietnam’s banking sector fell 2.34%, with 22 of 27 listed bank stocks closing in the red and leading the broader market lower as the VN-Index slipped to 1,863.49 points.Người Quan Sát Whenever bank stocks pull back, the familiar narrative centers on non-performing loans (NPL), credit growth, and net interest margin from the lending book. Those three metrics miss a different pressure building inside the balance sheet: roughly VND 820 trillion in government bonds held across the Vietnamese commercial banking system.
That VND 820 trillion figure represents approximately 14% of system-wide assets. These bonds carry near-zero default risk. But precisely because they are considered risk-free, this enormous portfolio tends to be overlooked in standard bank stock analysis. Q1/2026 data suggests that oversight is worth revisiting.

Two Types of Risk in One Bond
Every government bond carries two entirely independent dimensions of risk. The first is credit risk: the probability that the issuer cannot repay. For bonds issued by Vietnam’s State Treasury, this risk is essentially zero. The second is interest rate risk: when the market interest rate environment shifts, the coupon printed on an existing bond does not change. The result is a gap between the bank’s actual yield on its bond portfolio and its current cost of funding.
Investors who track NPL, credit growth, and lending NIM are effectively monitoring credit risk. Interest rate risk on the government bond portfolio tends to slip through unnoticed until it shows up in financial statements. When deposit rates rise, a bank’s funding cost adjusts quickly because average deposit maturities are short. But the coupon on the government bonds sitting in the vault stays fixed under the original issuance terms. This “phase mismatch” is the classical duration risk: one side reprices fast, the other stands still.
When Cost of Funds Overtakes Bond Yield
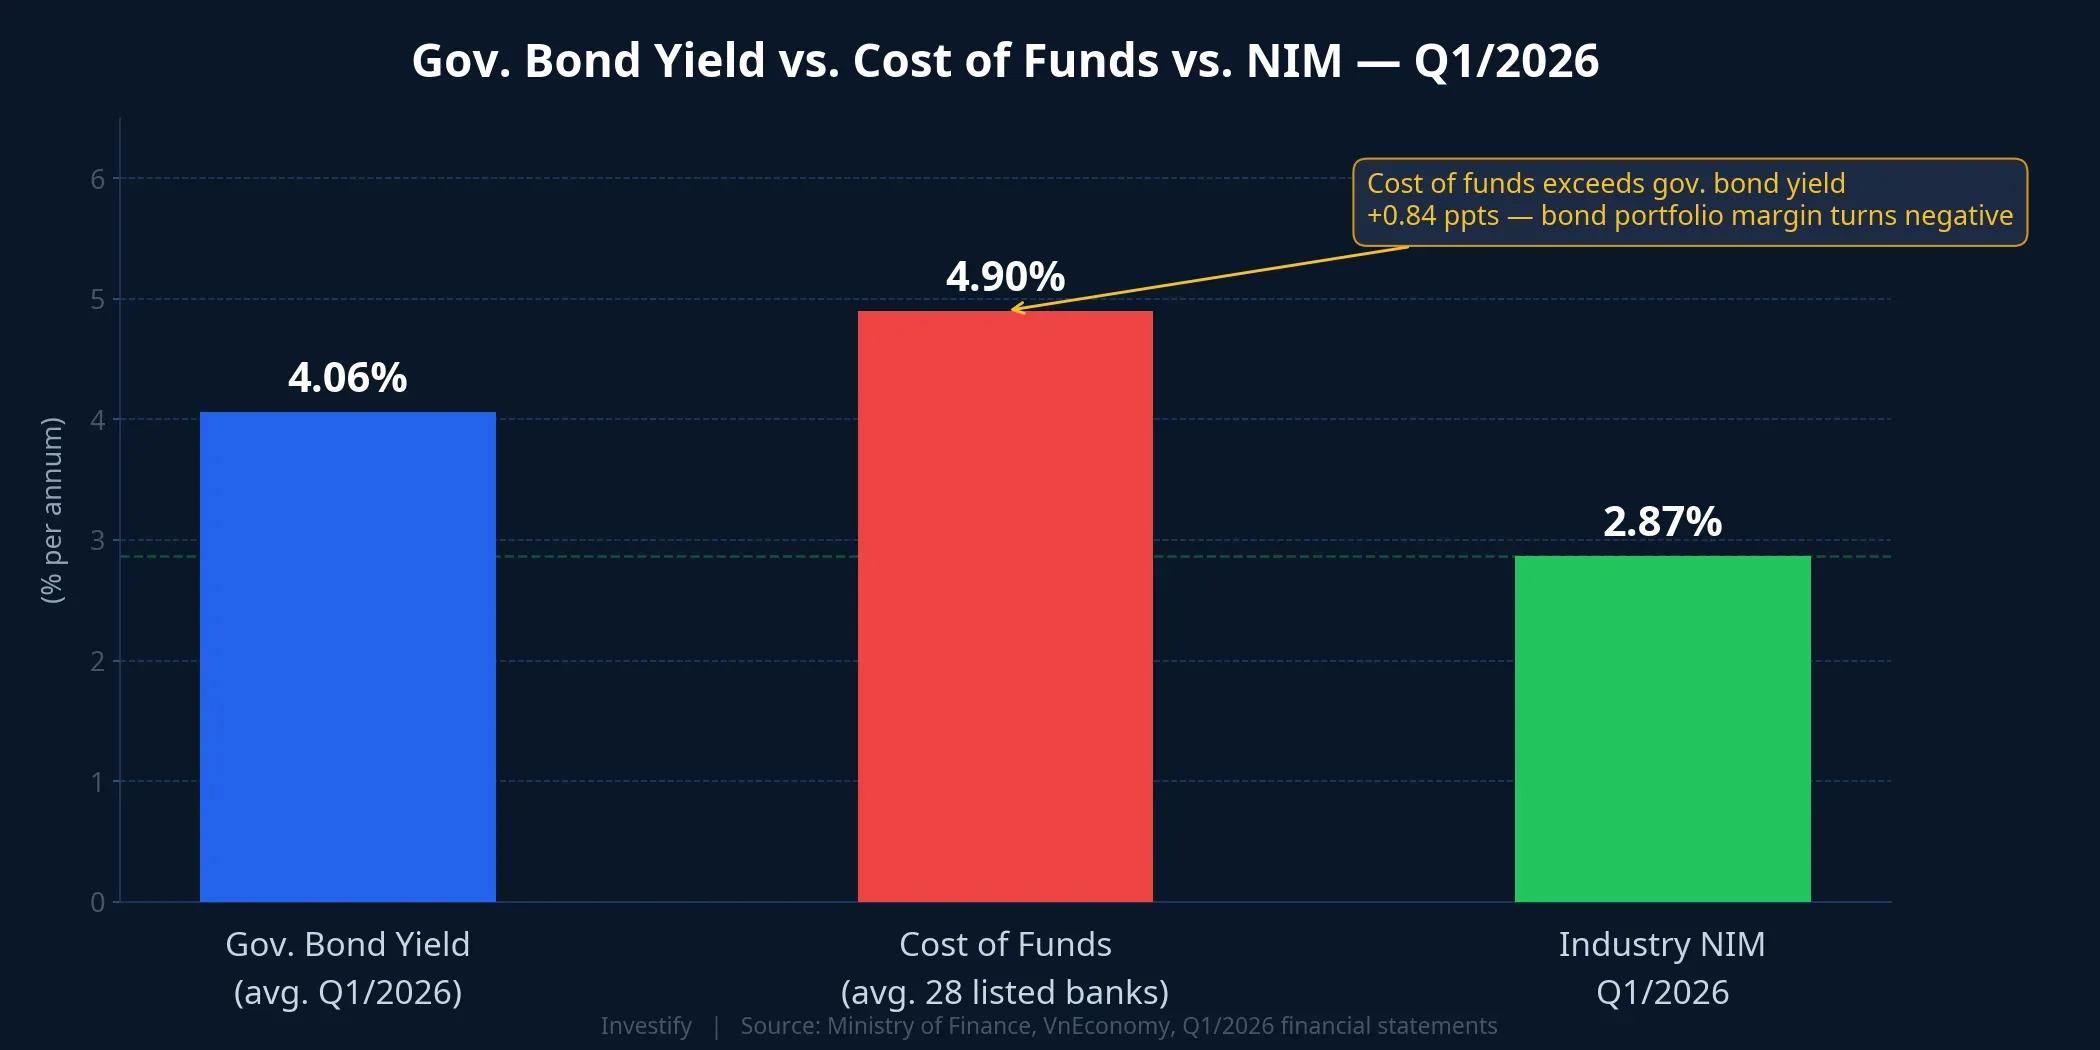
The Q1/2026 data makes the comparison concrete. The average government bond yield at issuance was approximately 4.06% per annum, per the Ministry of Finance.Nhân Dân Meanwhile, the average cost of funds across 28 listed banks rose from approximately 4.59% to 4.9% per annum during the quarter, adding roughly 31 basis points on an annualized basis.VnEconomy
The arithmetic is straightforward: a 4.06% bond yield against a 4.9% funding cost produces a negative 84 basis-point spread on the bond portfolio. Industry-wide NIM slipped to 2.87% in Q1/2026, down from 2.93% in Q4/2025.VnEconomy
This does not mean every bond in the portfolio was issued at exactly 4.06%. Banks have accumulated government securities across multiple years at varying coupon rates. But 4.06% is the Q1/2026 issuance average, reflecting a roughly 80 basis-point rise in TPCP yields versus 2025. Banks holding large volumes of older bonds — issued during lower-rate periods — face proportionally more pressure.
AFS vs. HTM: Where the Risk Surfaces on the Books
How interest rate risk appears on financial statements depends directly on how management classifies the portfolio. The two main buckets are available-for-sale (AFS) and held-to-maturity (HTM).
For AFS bonds, the bank marks the position to market every quarter. When market yields rise, bond prices fall, and the difference hits Other Comprehensive Income (OCI), reducing equity, even if the bank has not sold a single bond. In principle, this directly pressures capital adequacy ratios. For HTM bonds, the bank carries the position at amortized cost. No mark-to-market, no reported loss. But actual cash flows are still the old, lower coupon. The risk has not disappeared; it has merely shifted address: from equity to NIM, stretched across multiple quarters.
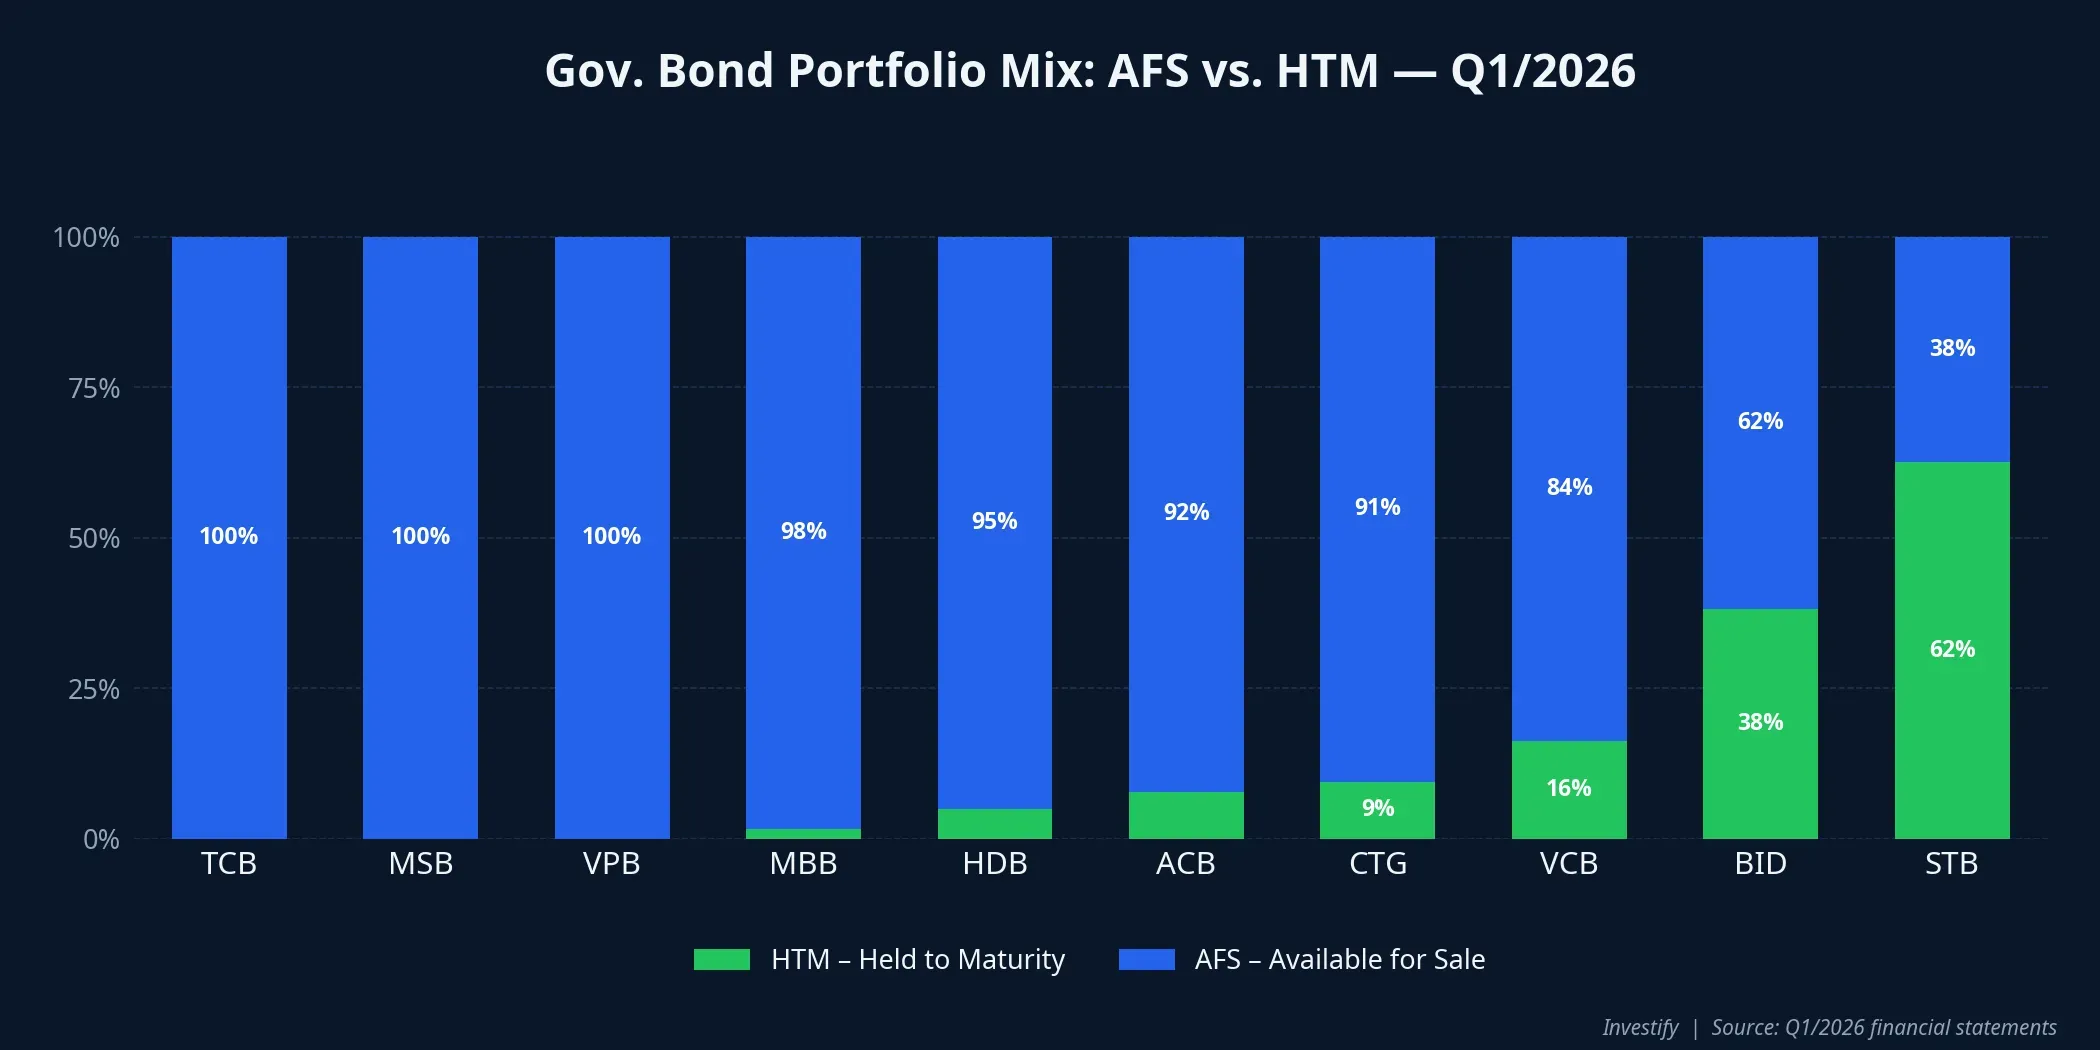
Q1/2026 data shows most private banks are heavily weighted toward AFS. TCB, MSB, and VPB hold 100% of their government bond portfolios as AFS. MBB is close behind at approximately 98% AFS, and ACB at around 92%. That means market price movements on these banks’ bond holdings flow directly into OCI and equity. Sacombank (STB) is a notable outlier at roughly 63% HTM, meaning its NIM will absorb the legacy coupon drag over multiple upcoming quarters while equity remains more stable.
Exposure Map: Who Is Under the Most Pressure
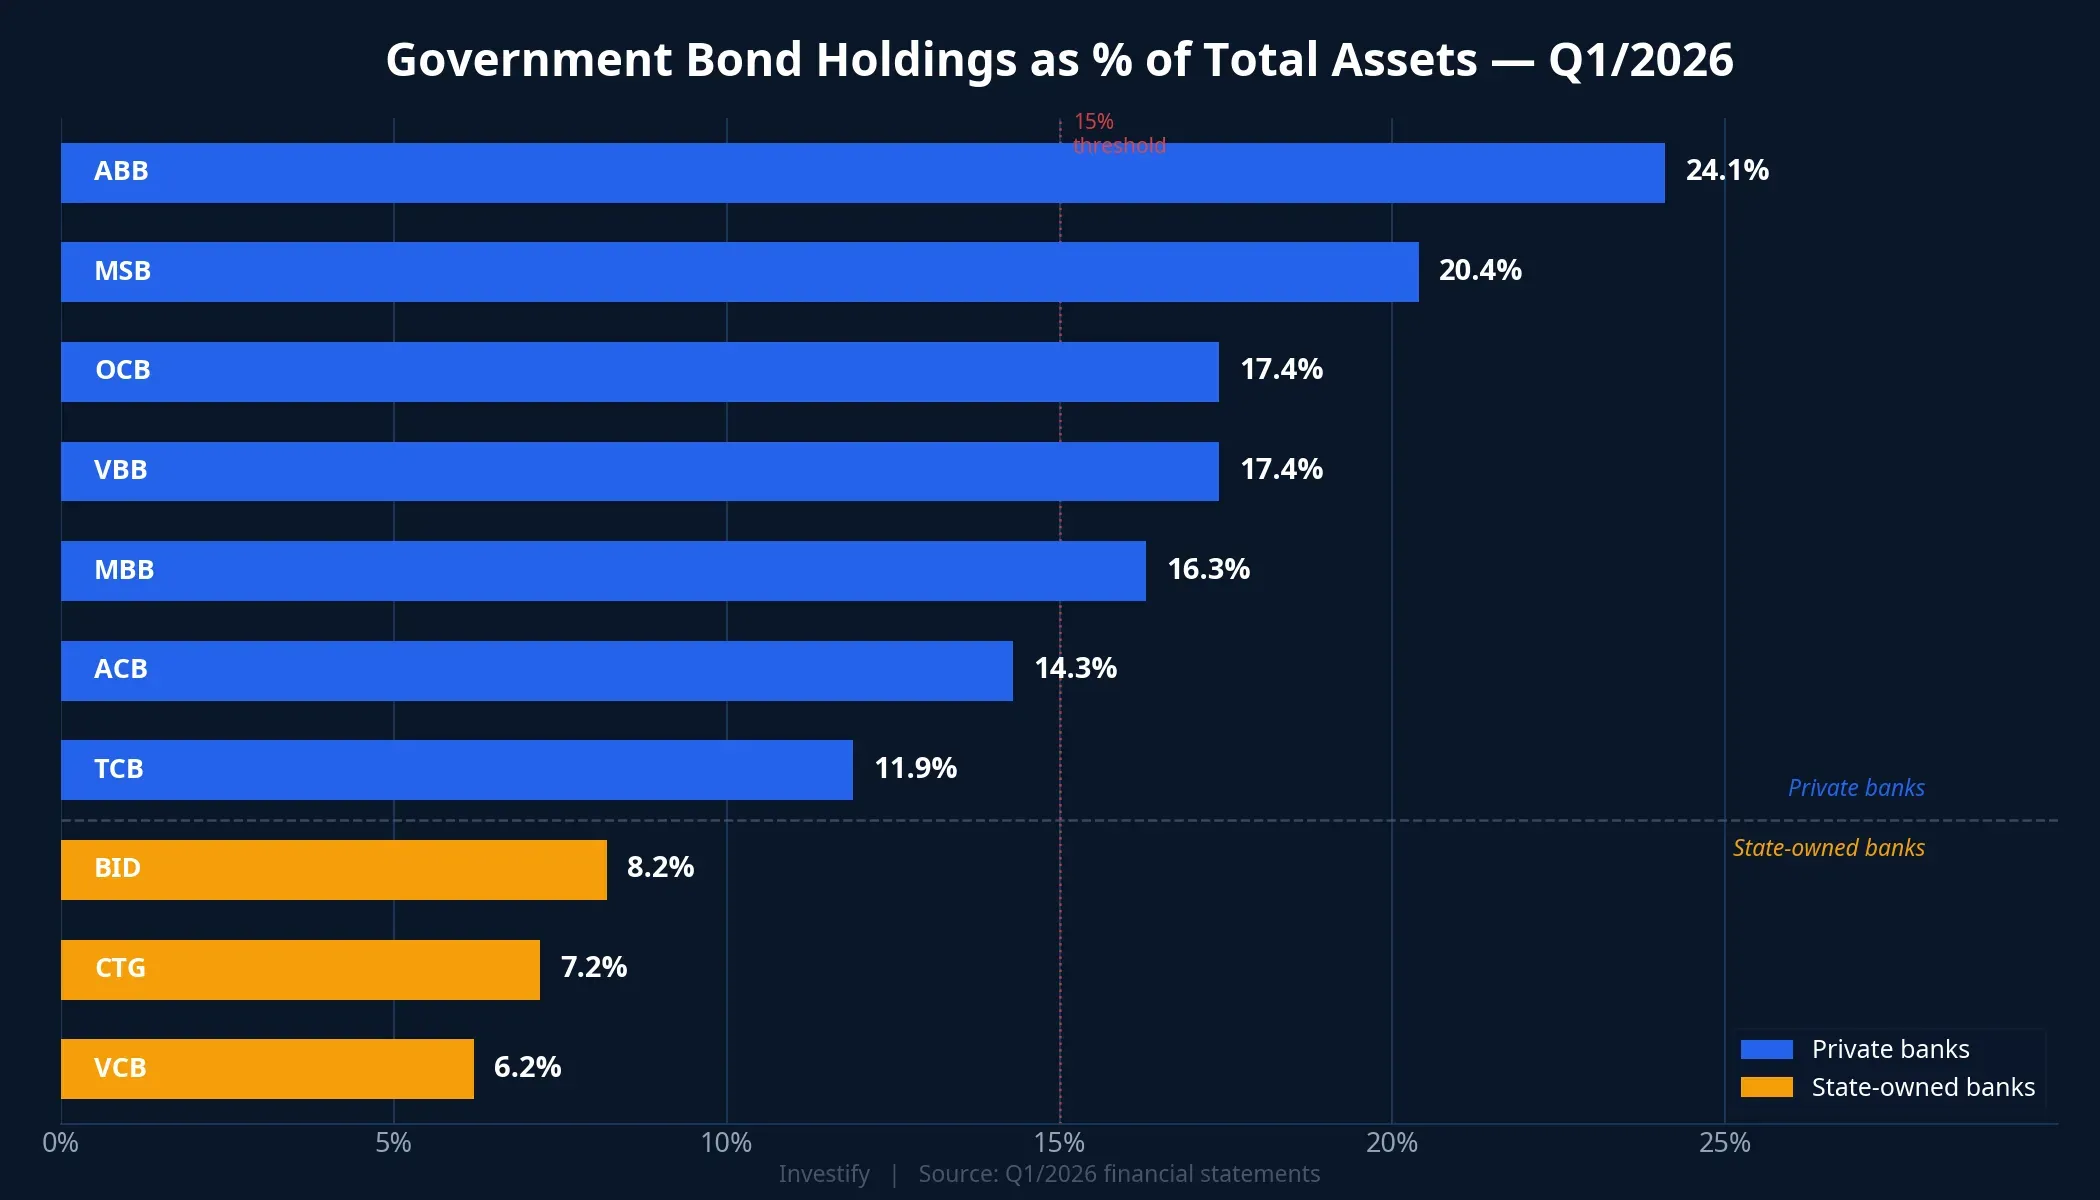
Measured by government bond holdings as a share of total assets, smaller and mid-sized private banks carry the heaviest exposure. ABB leads at approximately 24.1%, followed by MSB at 20.4%, OCB and VBB both near 17.4%, and MBB at around 16.3%. These banks typically have lower CASA ratios than the Big 4 and a narrower lending pipeline, which pushes them to park more assets in highly liquid instruments like government bonds.
State-owned banks sit at the other end of the spectrum: VCB at approximately 6.2%, CTG at 7.2%, and BID at 8.2%. The divergence reflects structural differences in balance sheet composition: the Big 4’s loan books are simply larger relative to their securities portfolios.
The impact has already shown up in Q1 results. ACB reported NIM down 17 basis points year-on-year to 2.77%; TPB came in at 2.83%.Vietstock Both banks carry very high AFS weightings, meaning bond price fluctuations hit equity through OCI at the same time that old coupons fail to cover rising funding costs, creating a dual squeeze on NIM.
Four Numbers to Add to Your Bank Analysis Framework
To get a fuller picture of bank stocks beyond NPL and credit growth, investors can pull four additional data points from the financial statement notes.
Government bonds as a share of total assets. Above 15% is the zone where the bond portfolio carries meaningful weight in the earnings structure. ABB, MSB, OCB, VBB, and MBB all sit in this range.
AFS versus HTM split within the investment securities portfolio. A high AFS weighting sends interest rate risk into equity via OCI when yields rise. A high HTM weighting sends it into NIM over several quarters without appearing on the equity movement schedule.
The gap between reported investment portfolio yield and cost of funds. Banks typically disclose average rates on their investment portfolios and funding costs separately in the financial notes. When these two numbers converge or invert, the bond portfolio’s contribution to net interest income effectively disappears.
CASA ratio. This is the direct buffer against rising funding costs. Banks with higher CASA ratios pay less on their liabilities in aggregate, which slows the pace at which funding costs catch up to the fixed coupons on legacy bond holdings.
What to Watch in Upcoming Sessions
In the current rate environment, the government bond portfolio is no longer the “neutral asset” that many analytical frameworks implicitly treat it as. With the gap between industry average funding cost (approximately 4.9%) and the Q1/2026 average bond yield (approximately 4.06%) sitting at 84 basis points, the margin contribution from this asset class has turned thin. Every new deposit mobilization cycle at higher rates compresses it further.
This analysis does not dismiss other NIM drivers: credit growth trajectory, the mix between retail and corporate lending, or competitive pressure on CASA from rising savings rates. The government bond portfolio is one layer in that picture. What makes it distinctive is that it tends to be underweighted in most bank stock read-throughs, even as VND 820 trillion in holdings makes the impact non-trivial.
Two questions worth adding alongside NPL and credit growth when analyzing bank stocks over the coming sessions: what share of total assets does each bank hold in government bonds, and is the portfolio predominantly AFS or HTM? Those two answers determine whether a given bank will absorb interest rate pressure through equity or through NIM — and with what intensity — over the next one to two quarters.