

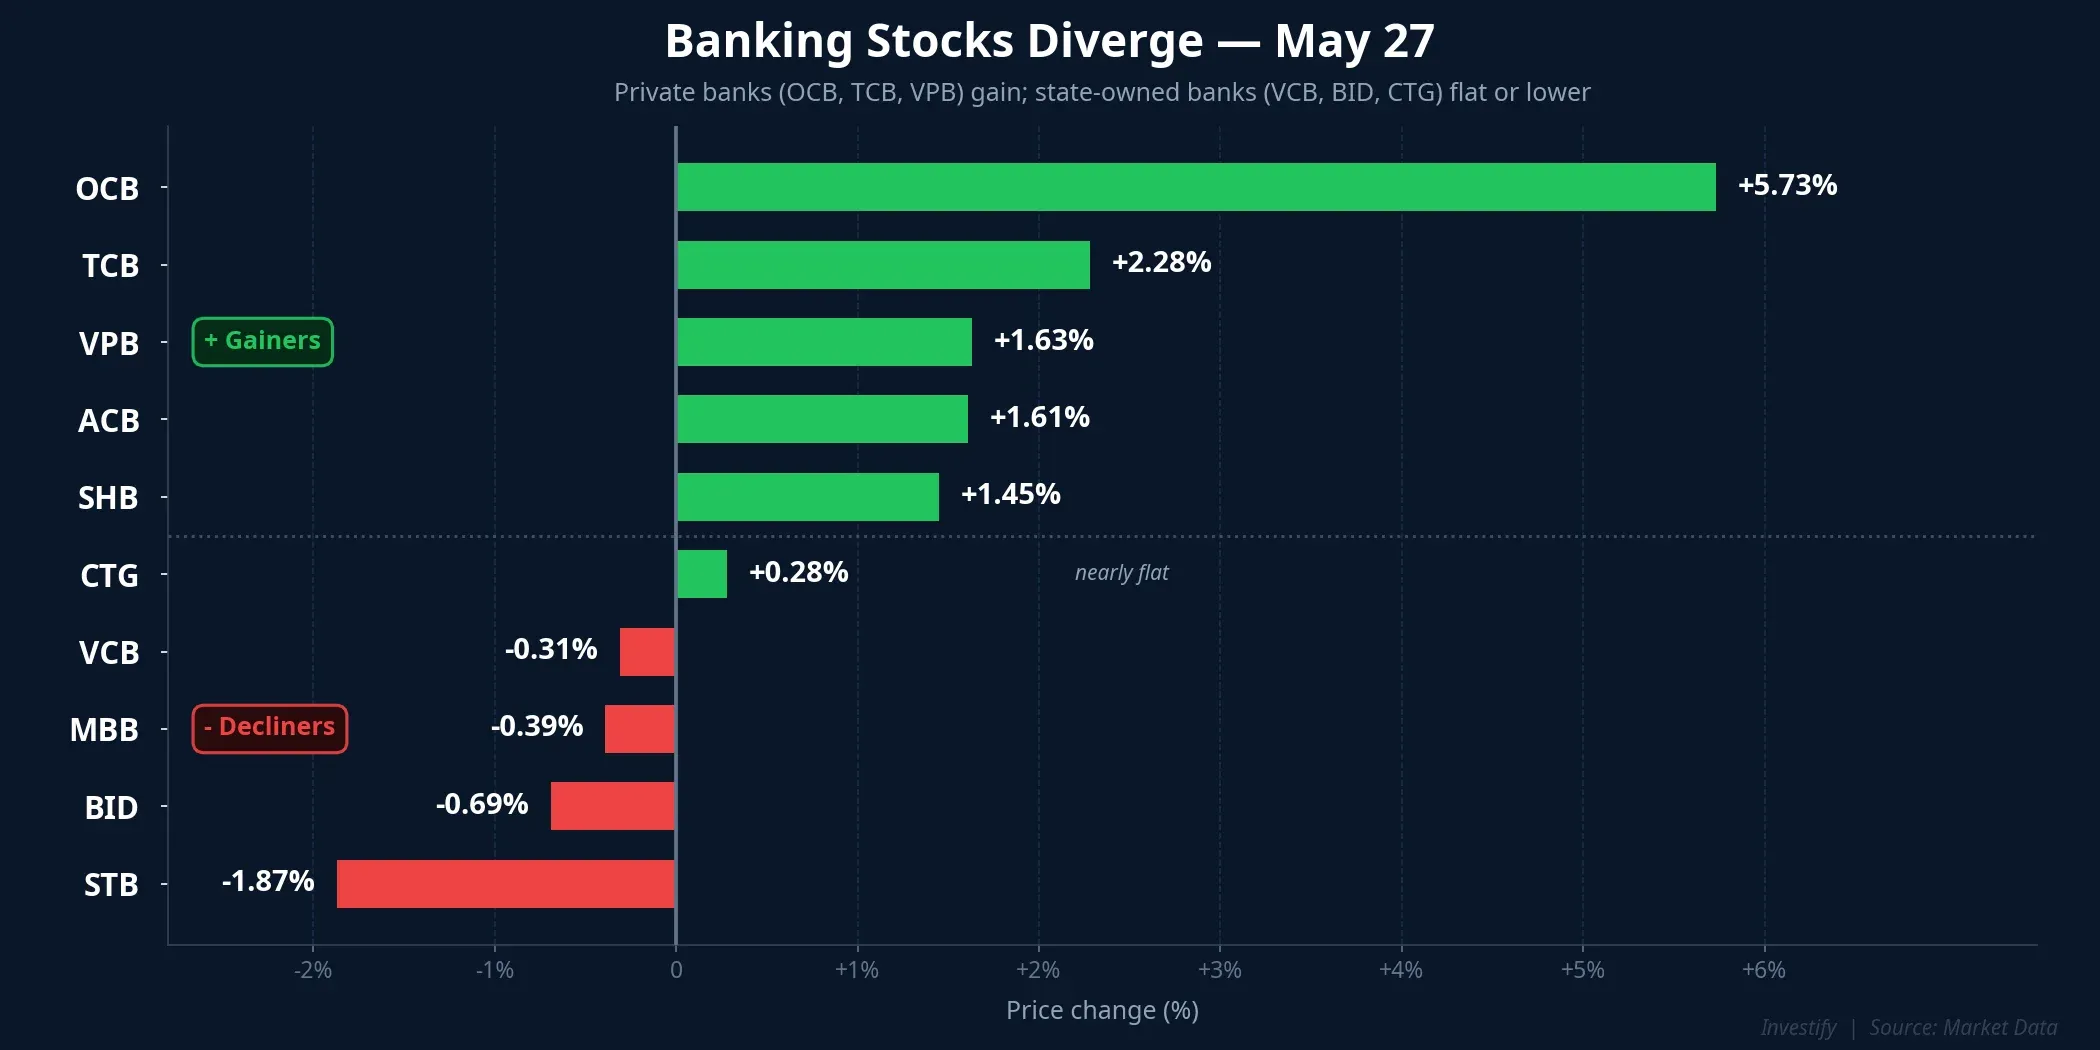
May 27 left a puzzling picture on many investors’ screens: bank holdings were in the green, yet VN-Index closed at 1,874.43 points, shedding 9.75 points, or 0.52%. OCB led the entire market with a 5.73% gain to VND 12,000. Techcombank advanced 2.28% to VND 33,650, VPBank rose 1.63%, and ACB gained 1.61%. SHB climbed 1.45% while turning over nearly 64.9 million shares, ranking among the most actively traded issues on the floor. On the face of it, a clear cohort of private bank stocks was attracting capital.
Yet on HOSE, 178 stocks fell against only 147 that rose. The index was still red. This was not a random contradiction. It was the inevitable outcome of two stories on completely different scales running in parallel on the same trading board on the same session.

Banks Diverge: Selective Capital Rotation, Not a Broad Surge
A closer look at the banking sector reveals the first key detail: the strength was far from uniform within the group itself. While private lenders climbed, Sacombank fell 1.87%, BIDV dropped 0.69%, MBBank declined 0.39%, and Vietcombank slipped 0.31%. VietinBank edged up just 0.28%, barely moving. Buying was concentrated entirely in private and mid-cap banks, while the state-owned pillars sat out the rally.
The divergence within the banking group is meaningful. If the buying had been triggered by a piece of sector-wide good news — say, a decision on interest rate ceilings or credit policy — the state-owned banks would not have been left behind. The pattern is more consistent with portfolio rotation: when the broader market is unstable, capital tends to flow toward groups perceived as having further upside and good momentum, then selects the best-positioned names within that group.
Expectations around net interest margins (NIM) and Q2 earnings for private banks provide the underlying support, but this backdrop existed before May 27. It was not session-specific news. In other words, this was money moving within portfolios. Not fresh capital rushing in because of a catalyst. And when money moves, it has to come from somewhere.
Vingroup Stocks: Profit-Taking After a Sharp Run
That somewhere was the Vingroup cluster. Vinhomes (VHM) fell 4.16% to VND 147,400. Vincom Retail (VRE) dropped 4.43% to VND 31,250. Vinpearl (VPL) shed 4.18% to VND 91,700. The parent company, Vingroup (VIC), held up comparatively better, falling 1.03% to VND 210,800.
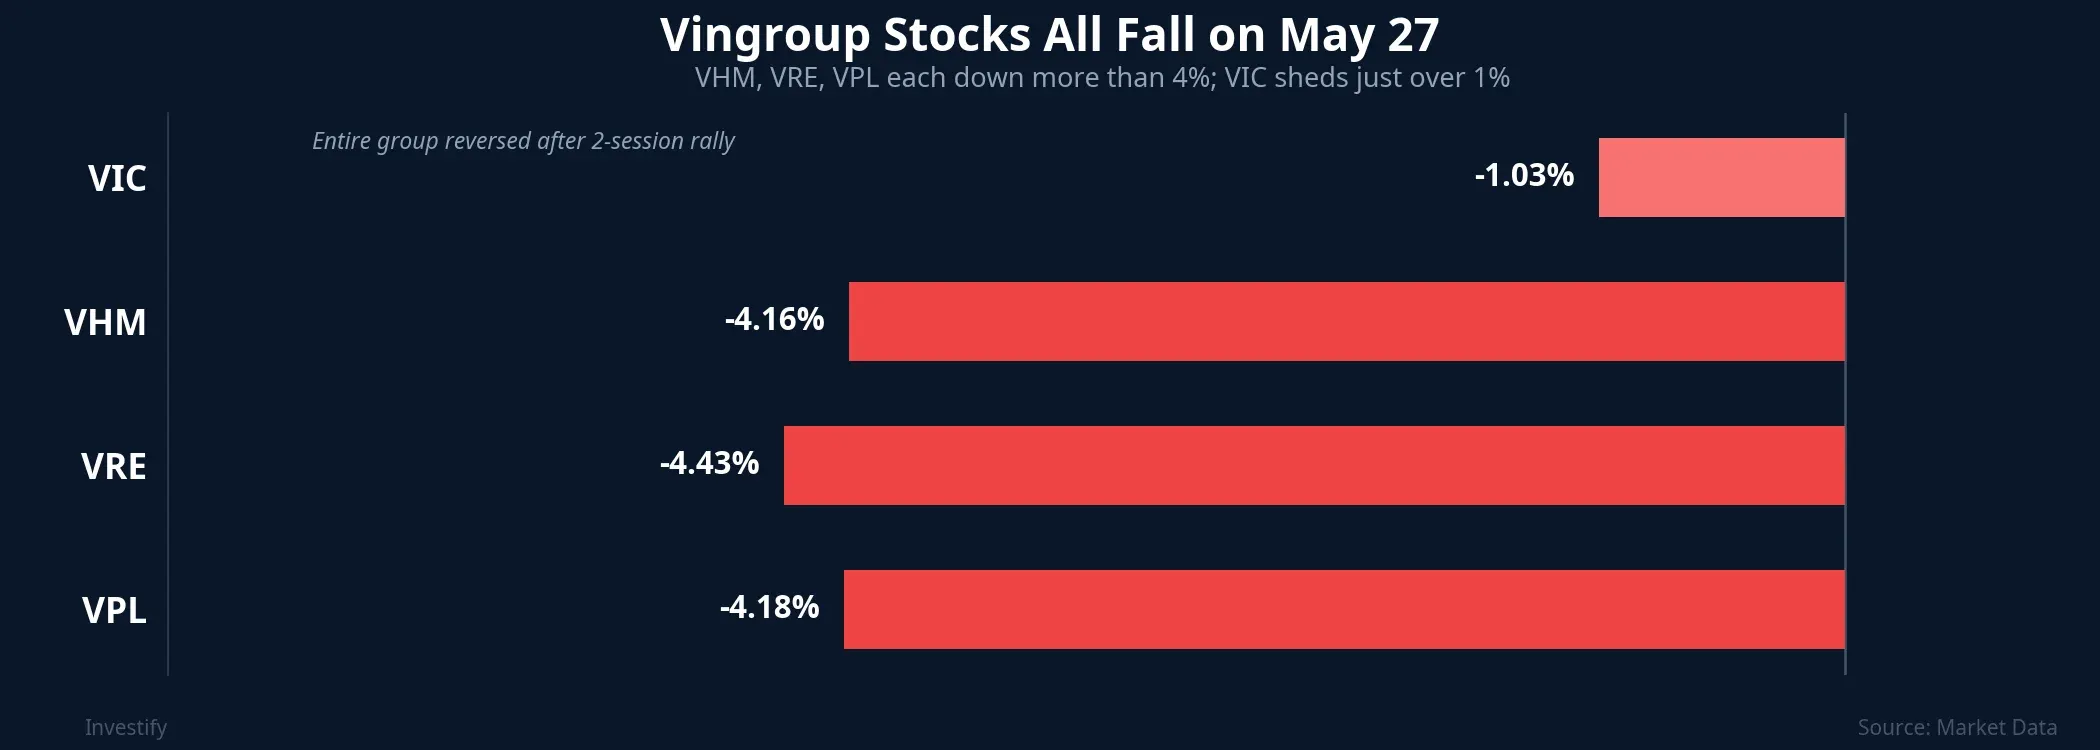
Notably, this decline came on the heels of a strong run. Just two sessions earlier, on May 25, VHM had climbed 3.19% to VND 158,700 and VPL gained 2.46%. The entire group reversing sharply after that advance is most consistent with profit-taking from positions accumulated in prior sessions.
Assigning a single cause requires caution: there was no specific piece of bad news large enough to explain a coordinated drop of more than 4% across the group. A more defensible reading is the confluence of three factors pointing in the same direction: profit-taking after a rally, continued foreign selling concentrated in property names, and general caution as the index retreated from last week’s peak. None of these factors represent a company-specific development. This is market pressure, not a Vingroup story.
The Market-Cap Lesson: How One Large Stock Outweighs Many Small Ones
This section answers the core paradox of “banks rising while the index falls,” and it is the most important takeaway from this session.
VN-Index is a market capitalization-weighted index: the larger a stock’s market cap, the more its price movement pulls the index. Vingroup (VIC) carries a market cap of approximately VND 1,624 trillion, and Vinhomes (VHM) approximately VND 605 trillion. Together, just these two names account for over VND 2,200 trillion. By contrast, OCB, the session’s top gainer, has a market cap of roughly VND 32 trillion, about 51 times smaller than VIC.
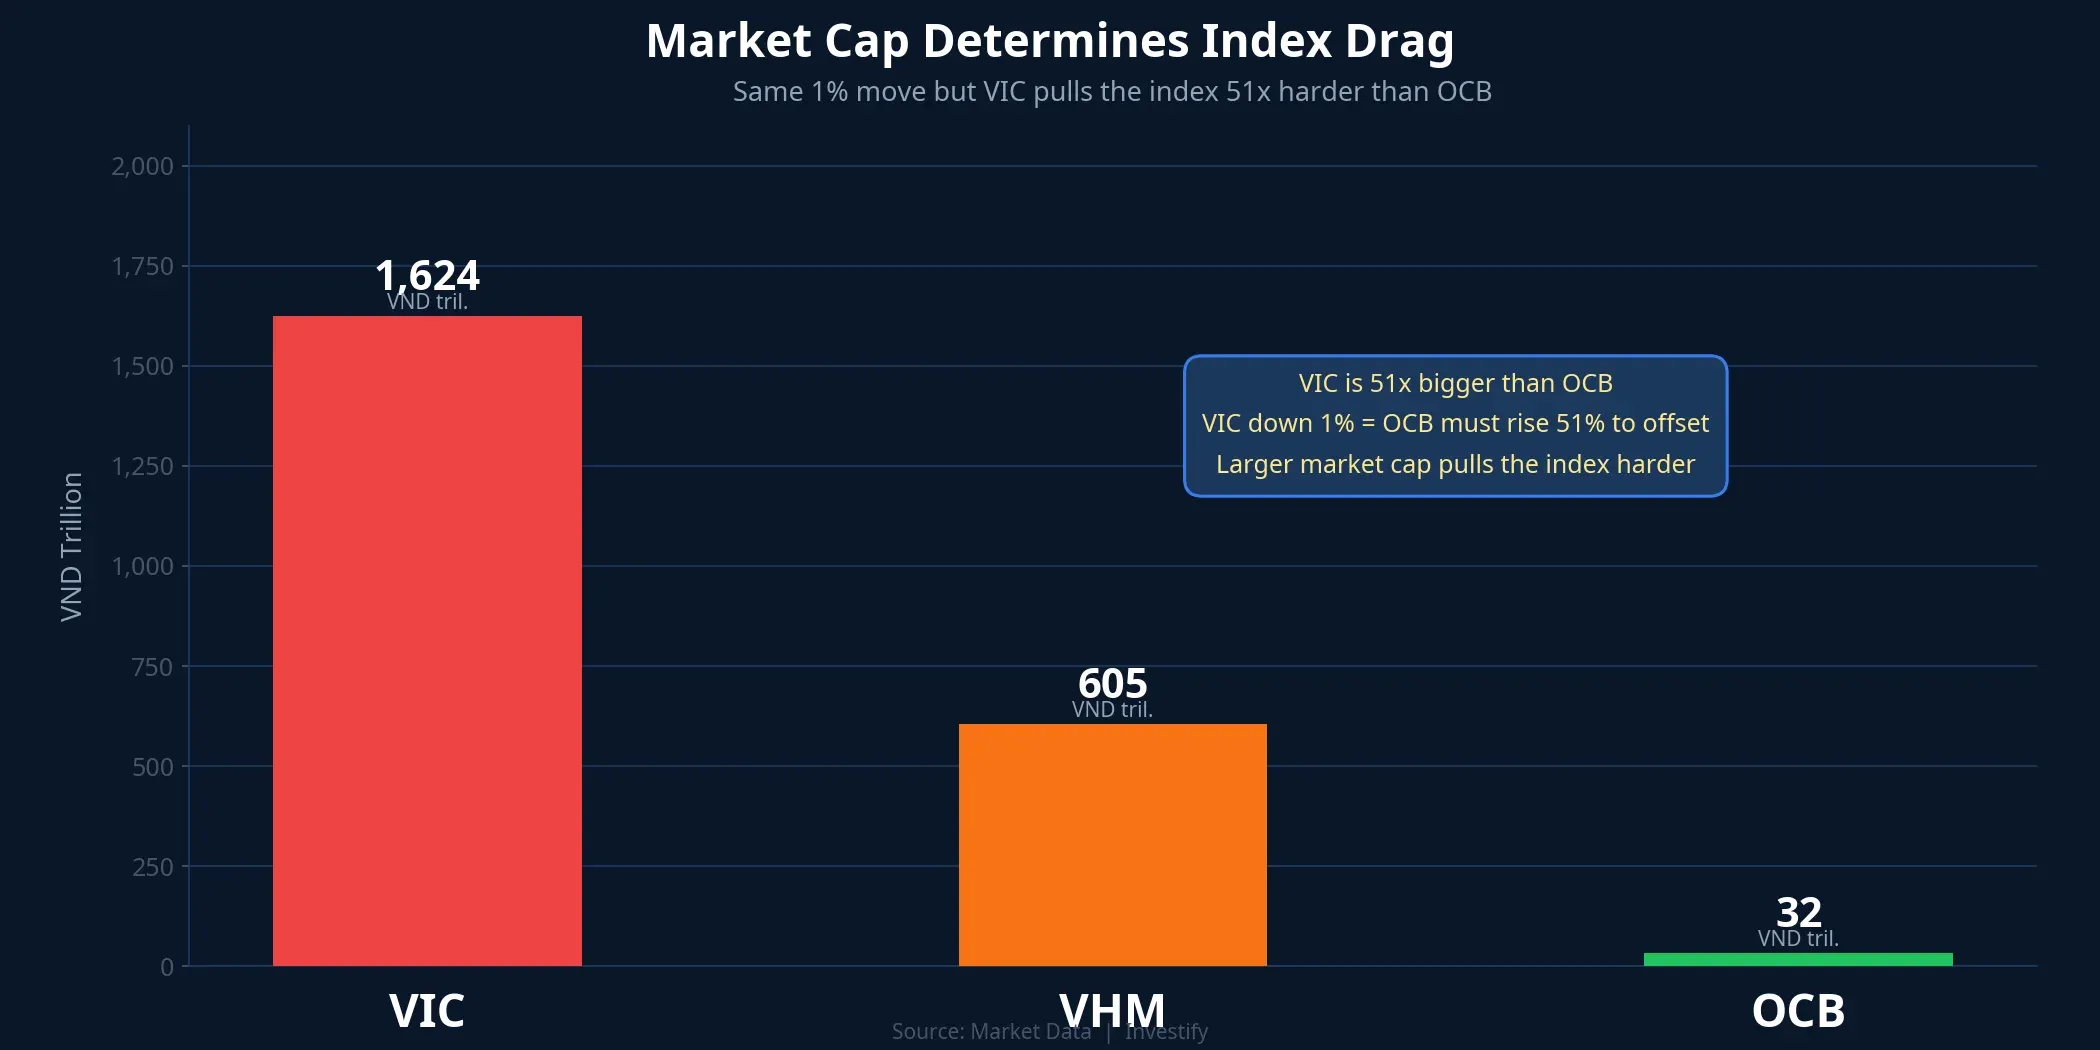
The arithmetic becomes concrete: VIC falling 1% is the equivalent of OCB needing to rise 51% just to offset the index impact. OCB did gain nearly 6% in this session, but that 6% on a VND 32 trillion base barely registers against a 4% decline by VHM on a VND 605 trillion base. Most of the banks that rose on the day belong to the mid-cap tier. Their combined weight was simply not enough to support the index when the largest names on the board were all in negative territory.
The picture that emerges is clear: VN-Index fell not because the market as a whole deteriorated, but because the drag was concentrated in a handful of names with the largest weights. This is a practical lesson worth internalizing. “VN-Index is down” and “my stocks are down” are two separate facts. A red-index session can still be a green session for a portfolio tilted toward private bank stocks. Conversely, a majority of stocks advancing does not guarantee a positive index if the top-weighted names are simultaneously declining.
Three Signals Worth Watching for May 28
The real question going into the next session is not whether VN-Index opens green or red, but whether capital continues along this divergent path.
First, the durability of the bank inflow. If buying broadens from private banks to include the state-owned pillars — Vietcombank, BIDV, VietinBank — that signals genuine sector commitment rather than selective short-term rotation. If only a handful of names take turns rallying before fading, the move looks more like tactical reallocation that could reverse quickly.
Second, whether the Vingroup cluster stabilizes. Because of the sheer weight in the index, VIC and VHM simply finding a floor would remove a substantial portion of the index drag, even if nothing else changes. VND 210,800 for VIC and VND 147,400 for VHM are the reference levels to watch.
Third, the direction of foreign flows in the property sector. A sustained string of net foreign selling is the single largest short-term risk for the large-cap group. When that selling slows or reverses, the one-directional pressure on the index should ease meaningfully.
Q2 earnings from private banks, expected around July, will be the real test of the thesis that the capital flowing into the sector on May 27 appears to be pricing in. Until then, these three signals, not the closing point level, will determine whether May 27 represents an ordinary correction within a rising trend or the start of a more extended consolidation phase.