
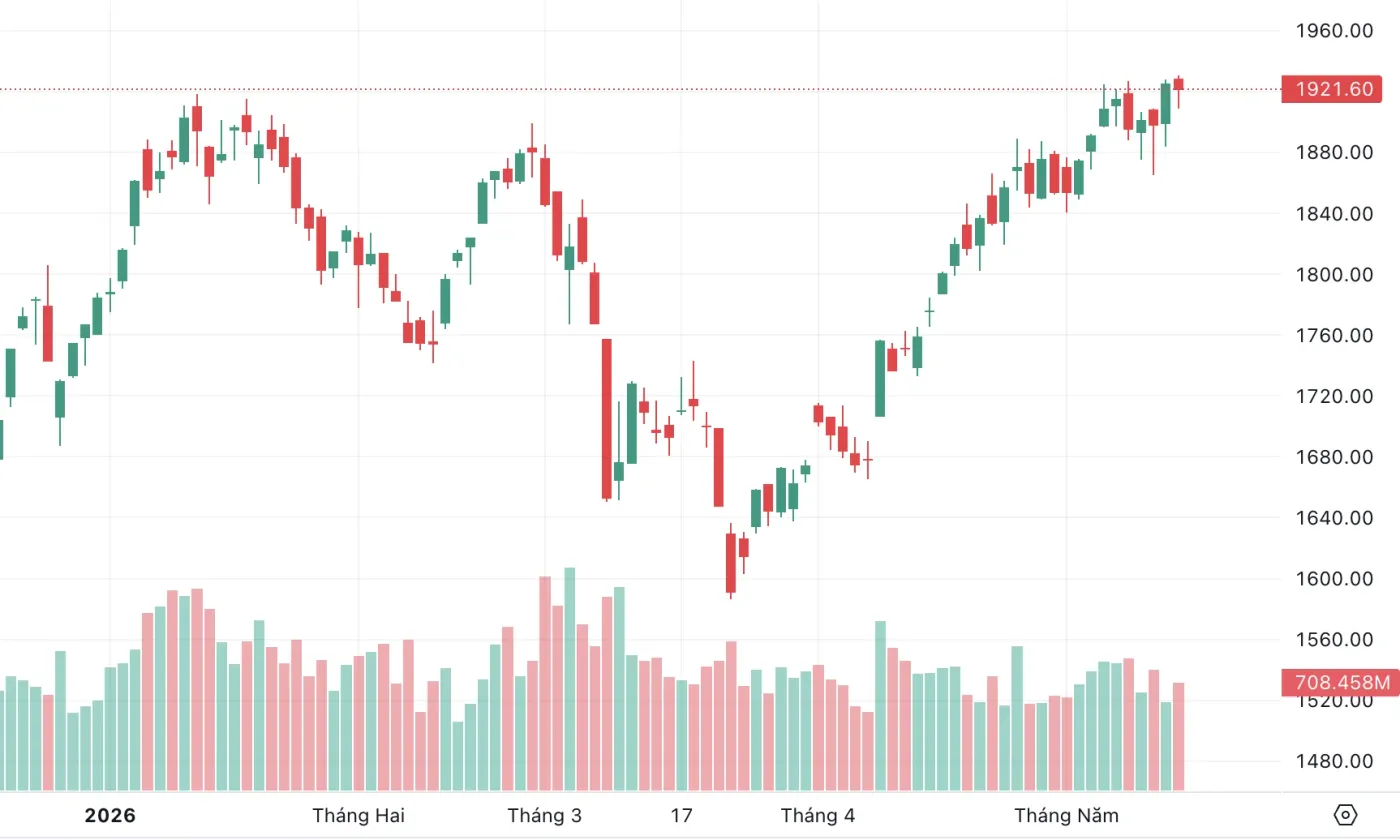

On the morning of May 22nd, VN-Index fell nearly 32 points to 1,864.97, with more red than green across the board. At the same time, a figure from FiinTrade was circulating widely: 81 out of 83 Vietnamese equity funds recorded a profit in April 2026, with an average return of +2.2%.BaoMoi/FiinTrade For first-time investors rattled by the current pullback, that positive number is easy to read as reassurance: the funds are holding up while the market swings around.
But the same data source includes a second line that matters far more: only 3 of those 83 funds actually outperformed both VN-Index and VN30 during April.BaoMoi/FiinTrade These two figures are not contradictory. They answer two entirely different questions, and understanding that difference is what separates useful performance analysis from false reassurance.
When the Market Surges, Almost Every Fund Makes Money
April 2026 was one of the strongest months VN-Index has seen in years. The index climbed from 1,674.49 at the end of March to 1,854.10 at the close of April, a gain of 10.7%. The surge followed FTSE Russell's announcement that Vietnamese equities would be promoted to Secondary Emerging Market status, drawing significant inflows into the market.
Think of it this way: in a month where most Vietnamese stocks rose somewhere between 5% and 15%, nearly every equity portfolio was going to show a positive return. That is not because the fund managers were doing anything exceptional that particular month; it is because the whole market was rising. Like all boats rising on a strong tide. The 81-out-of-83 figure accurately reflects that reality, but it says nothing about management quality.
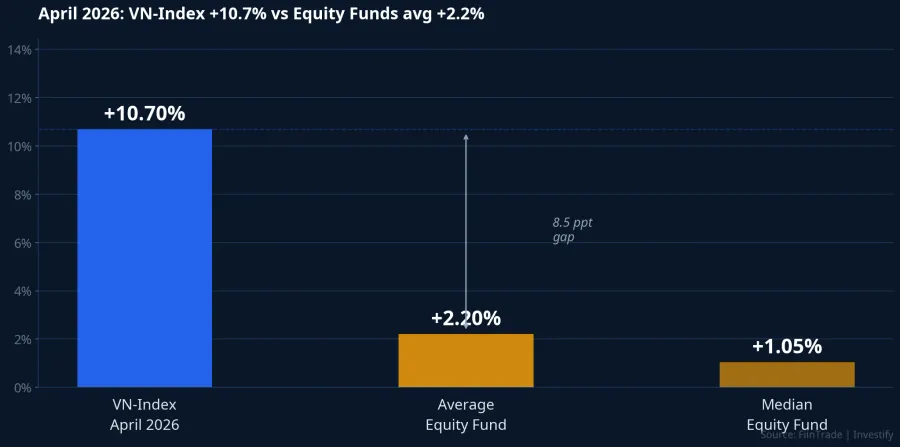
The more meaningful comparison is: by how much did the fund earn relative to the benchmark it is supposed to beat? A Vietnamese equity fund's natural benchmark is VN-Index or VN30, not zero. An average return of +2.2% in a month where VN-Index gained 10.7% means the average fund captured roughly one-fifth of the market's rally. That is a poor result, even if the number looks positive in isolation.
Why Active Funds Lagged So Far Behind the Index
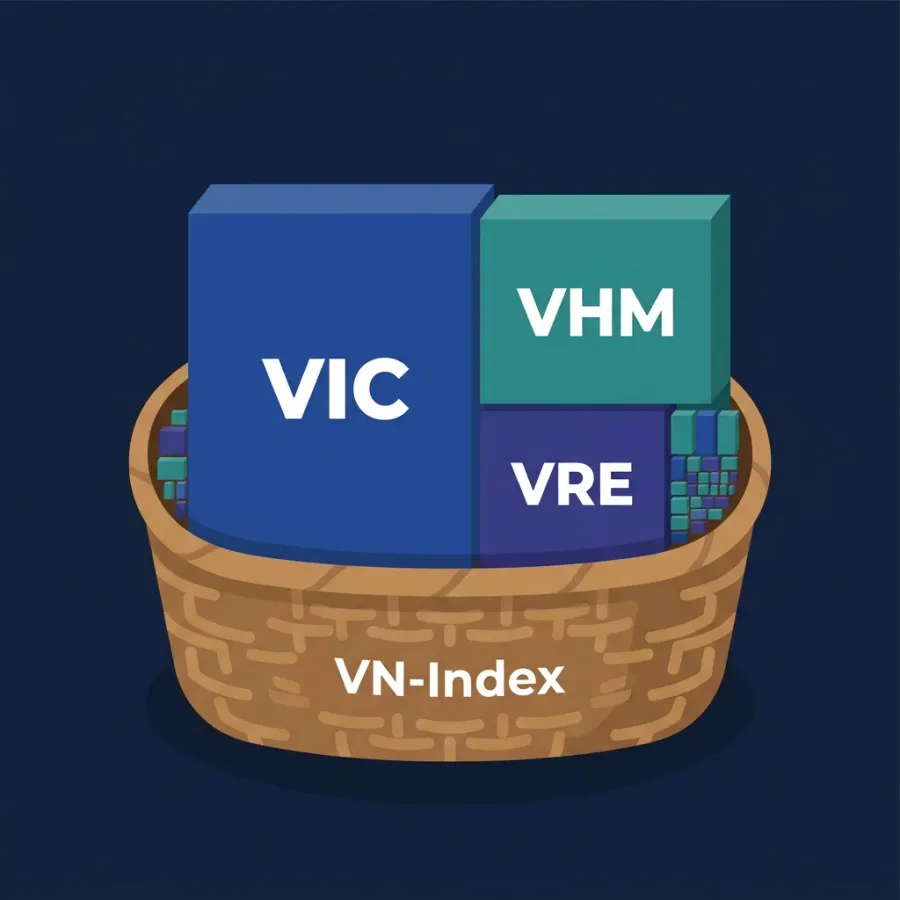
April 2026 was unusual because the gains were concentrated rather than broadly distributed. According to FiinTrade data, the bulk of VN-Index and VN30's appreciation was driven by the Vingroup family of stocks, VIC, VHM, and VRE. These names carry very large index weights.BaoMoi/FiinTrade
Most active equity funds, meanwhile, hold significantly less exposure to the Vingroup cluster than the index does, reflecting either risk management guidelines or their own investment philosophy. When Vingroup pulled the index sharply higher, active funds were left behind almost by design.
The three funds that did beat VN-Index in April were largely passive vehicles: ETFs tracking VN30 or foreign ETFs with heavy Vingroup exposure, posting returns of 10% to 14%. The one active fund to clear the bar was EVESG with a gain of +12.1%. Looking at the NAV performance of major funds, the distance from VN-Index tells the story clearly.
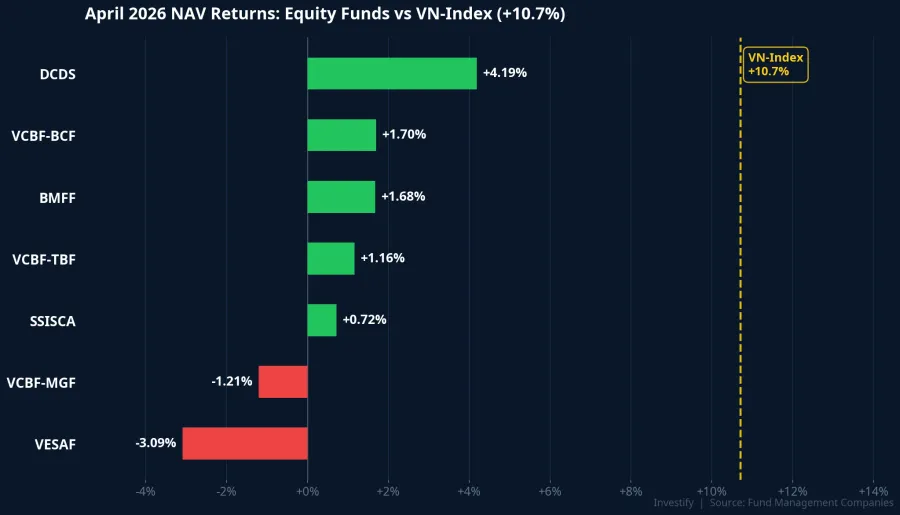
DCDS came closest among active managers at +4.19%, while most others fell in the +1% to +2% range. VESAF and VCBF-MGF were the only two funds to lose ground in April, declining -3.09% and -1.21% respectively. Both held meaningful positions in mid-cap stocks that had already run hot during Q1 and saw profit-taking as money rotated into the Vingroup names.
The Same Structure That Held Funds Back Also Protects Them in a Pullback
April alone tells only half the story. The same portfolio construction that causes active funds to underperform during a concentrated rally also cushions them when the market corrects.
From the peak of 1,927.94 on May 18th to 1,864.97 on the morning of May 22nd, VN-Index fell approximately 3.27%. Over that same stretch, major equity fund NAVs moved far less: VESAF fell just -0.14%, DCDS fell -0.26%, VCBF-TBF fell -0.28%, BMFF fell -0.62%, VCBF-BCF fell -0.92%, and SSISCA fell -1.21%.
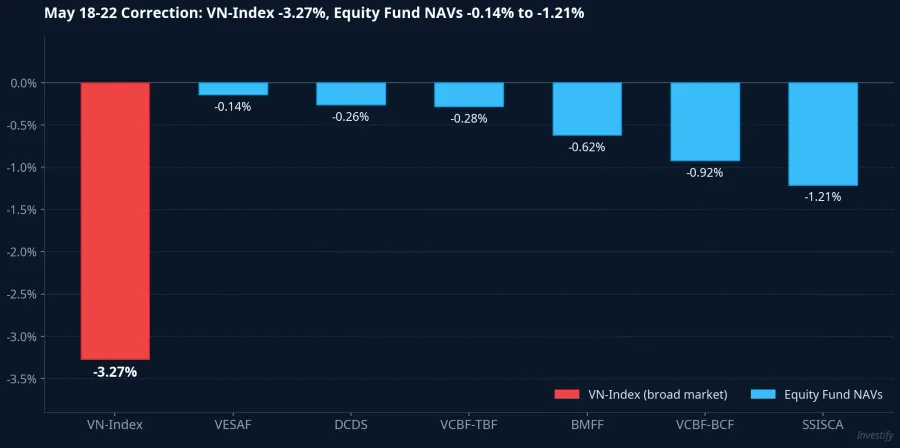
This behavior is captured by beta. Looking at history from 2021 to 2026, across all VN-Index corrections of 10% or greater, the beta of most domestic equity funds during sharp down-moves had a median of approximately 0.03 and a mean of 0.11. In plain terms: when VN-Index falls 1%, the median fund NAV falls only about 0.03%. That low beta is not a coincidence. It reflects the fact that funds maintain some cash buffer, diversify more broadly than the index, and deliberately underweight the heaviest index constituents.
This is a structural characteristic, not luck or skill. Funds with higher beta, such as VFMVF1 (DCDS) with a median beta of around 0.93 and VFMVF4 at around 0.99, track VN-Index more closely in both directions. The majority of active funds, carrying lower beta, naturally give up some upside in concentrated rallies and offer more cushion when the market falls broadly.
Three Ways to Read Fund Performance More Accurately
Whether you already hold fund certificates or are deciding whether to buy, these three frameworks will help you get more signal from any monthly performance report.
Compare against the benchmark, not against zero. A Vietnamese equity fund should always be measured against VN-Index or VN30 for the same period. Gaining +2% in a month when the index rose 10.7% is a poor outcome, regardless of the positive sign. Many investment apps display NAV gains in green without placing them next to the benchmark return. You need to supply that context yourself.
Evaluate over a cycle, not a single month. The same fund can look strong in a down month and weak in a sharp rally simply because of its low beta. To assess whether a fund is genuinely creating value, you need to observe it through at least one significant rally and one pullback, which generally means a minimum of twelve months.
Know what you are paying fees for. Active funds typically charge management fees of around 1.5 to 2% per year. That fee is for the potential to generate alpha, meaning returns above the index net of costs. If a fund consistently tracks or trails its benchmark across multiple quarters, a low-cost passive ETF such as E1VFVN30 or FUEVFVND usually offers equivalent market exposure at a lower price.
Looking Ahead
The 81-out-of-83 figure for April is accurate. It simply answers the wrong question. The right question is not "did the fund make money?" but rather "did the fund make money relative to its benchmark?" and "is this fund's beta profile actually suited to my goals?"
Low beta in most active equity funds is a structural feature with genuine trade-offs on both sides. It limits your exposure when the market rallies hard on concentrated names, and it softens the blow when a broad correction hits. Understanding this beforehand means fewer surprises, and a clearer basis for choosing between an active fund and a passive ETF depending on what you actually want from the allocation.
April performance reports are behind us. May reports will arrive in a few weeks. The key variable to watch is whether the Vingroup cluster continues to drive the index or whether gains broaden across the market, which would close the gap between active and passive strategies considerably.