


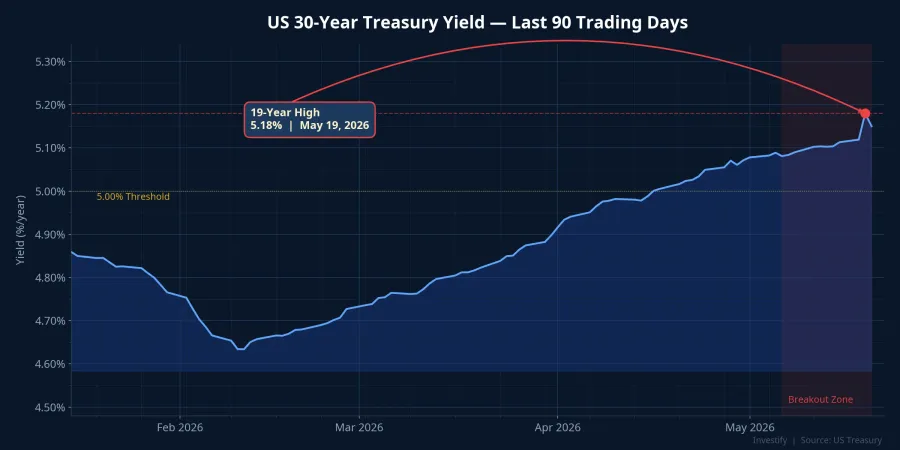
The US 30-year Treasury yield hit 5.18% on May 19, a level not seen since July 2007, nearly 19 years ago. Three forces converged simultaneously to push global bond investors to demand higher yields to compensate for long-term risk. Wall Street closed broadly lower that evening: the Dow Jones fell 0.65%, the S&P 500 lost 0.67%, and the Nasdaq retreated 0.84%.CNBC Asian markets opened lower in sympathy, and the VN-Index on May 19 pulled back from its all-time high of 1,927.94, a record set just one day earlier.
The bigger picture is taking shape: when long-dated US Treasury yields rise, global capital tends to rotate toward safe-haven assets, putting pressure on emerging markets. The practical question is where this correction stands and which support level the VN-Index is now testing.
Three Forces Driving the US Yield to a 19-Year High
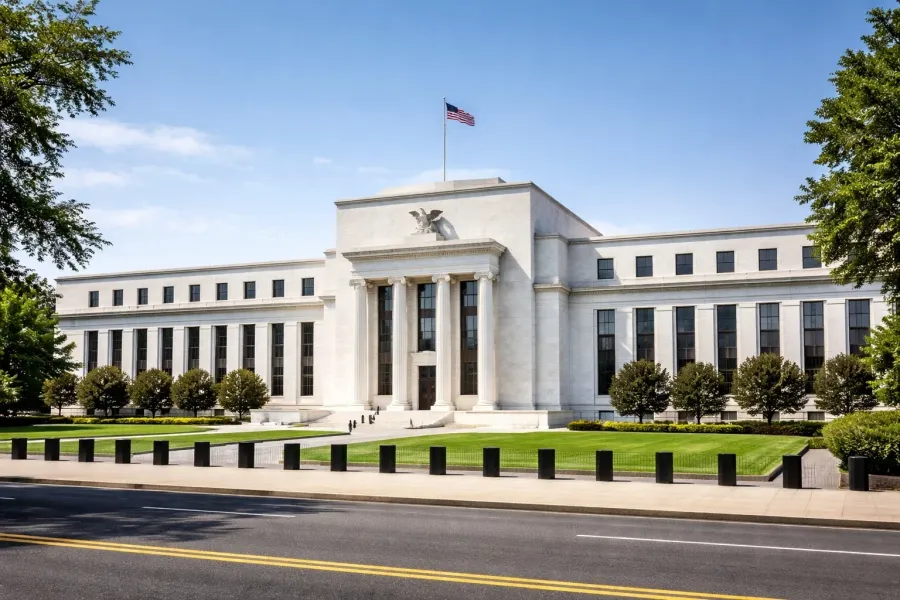
The first force — and the direct trigger for this particular session — was a statement by Kevin Warsh, Chairman of the Federal Reserve. Warsh was confirmed by the Senate on May 13 with a 54–45 vote, succeeding former Chairman Jerome Powell.CNBC During his responses to senators after the April 21 confirmation hearing, Warsh stated that Fed officials should not receive "special privileges" in international financial matters, and proposed a new "Fed–Treasury Accord" to govern the central bank's balance sheet.CNBC Six former Fed officials interviewed by CNBC described the remarks as "unclear" and "concerning" with regard to central bank independence. Markets interpreted the signal as: the Fed may be less independent in its international policy stance, prompting bond investors to demand an extra risk premium to hold long-dated Treasuries.
The second force is inflation anxiety stemming from Middle East tensions. Brent crude held near USD 110 per barrel amid escalating supply risks from the region. A sustained high oil price environment pushes US inflation expectations upward, and bond investors are unwilling to accept yields below expected inflation, so they demand more.
The third force is a widening US fiscal deficit, which keeps the supply of long-dated Treasuries abundant. When supply grows without a matching increase in demand, bond prices fall and yields rise. The inflation and deficit pressures were already in place, but they were amplified significantly when Warsh's remarks added a "Fed independence" risk premium, forcing markets to reprice all long-term risk simultaneously.
VN-Index: From All-Time High to a Critical Test
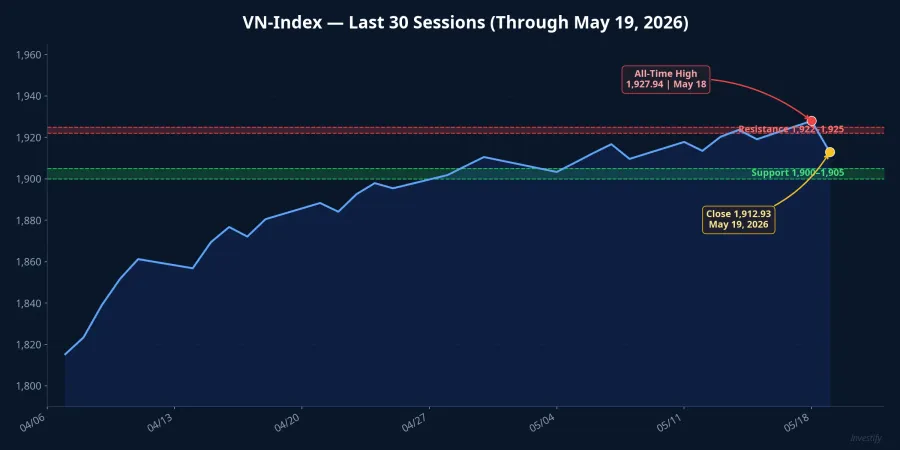
The VN-Index closed May 19 at 1,912.93, down 15.01 points or 0.78%. With 215 decliners and only 84 gainers, selling pressure clearly dominated. Foreign investors sold a net VND 705 billion, though this figure remained below the one-month average of negative VND 846 billion. Outflows were real but not accelerating.
The oil and gas sector bore the heaviest selling, with multiple stocks hitting the floor limit simultaneously: GAS fell 6.99%, BSR dropped 6.88%, PVD declined 6.98%, and PVT lost 6.92%.CafeF This group had rallied sharply on expectations of elevated oil prices, and when Brent merely dipped, investors took the opportunity to lock in gains. This is profit-taking in an overheated sector, not broad-based panic selling.
Bank Stocks Diverge: A Selective Capital Flow Signal
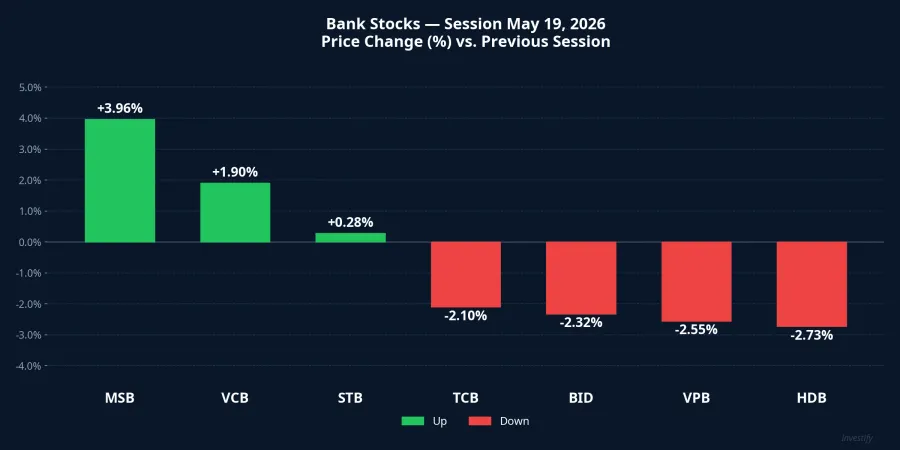
In a broadly declining session, the banking sector is the most informative industry to read because it directly reflects where money is flowing. BID fell 2.32%, HDB dropped 2.73%, TCB lost 2.1%, and VPB declined 2.55%. On the other side, MSB gained 3.96%, VCB rose 1.9%, and STB edged up 0.28%. Same industry, same session, opposite reactions.
Domestic capital is being selective: rotating into the defensive state-owned leaders and out of large-cap private banks with higher cyclical sensitivity. When investors still bother to differentiate within a sector rather than selling indiscriminately, it typically signals that the market has not yet entered panic mode. This divergence carries more information than the headline index number.
Three Signals to Watch in the May 20 Session
Do banks align this time? May 19 revealed a clear split between state-owned and private banks. If VCB and MSB hold green in the first 30 minutes of May 20 trading, it signals that domestic capital is still rotating into defensive names rather than exiting the market altogether. If VCB turns lower alongside the private banks, selling pressure is spreading to the market's leading names and the probability of breaking support rises.
Will the 1,900–1,905 zone hold? The 5-day moving average pulled back to 1,917 at the end of May 19, with the 20-day MA sitting around 1,881. The nearest support is 1,900–1,905, corresponding to the post-peak low and the lower boundary of the January 2026 peak zone. A Double Top pattern is forming around the 1,927.94 high. A daily close below 1,900 could trigger technical selling. Short-term resistance sits at 1,922–1,925. A break above that range reopens the path to retest the 1,930–1,933 peak zone.
Foreign flows and morning liquidity. Foreign net selling of VND 705 billion on May 19 was below the monthly average, suggesting outflow pressure had partially eased. If May 20 sees net foreign selling exceed VND 1 trillion and total market turnover fall below VND 25 trillion, that combination is unfavorable: capital withdrawals on one side with insufficient domestic buying to offset on the other. May 19 turnover was approximately VND 32,360 billion, still reasonably healthy. Cumulative traded value at 10:00 AM is the fastest indicator of morning demand depth.
The US Yield: The Foundational Variable for the Week Ahead
The US 30-year Treasury yield is the variable that will most influence the market's direction in the coming week. The last time this yield sustained above 5% for an extended period was 2007–2008. Emerging markets at that time faced significant capital outflows. History may not repeat precisely, but the mechanism is the same: high long-dated US yields raise the opportunity cost of riskier assets, from equities to emerging-market bonds.
The current picture: the VN-Index has not broken a major support level, foreign selling has not reached alarm levels, and domestic capital flows remain discriminating. This is the structure of a post-peak correction, not a trend reversal. That said, if the US yield stays above 5.1% through next week, emerging-market outflow pressure will persist and the probability of testing the 20-day MA at 1,881 rises. If yields retreat below 5%, regional markets have room to recover.
The deciding factor does not lie in the domestic trading board but in the US bond market, where trillions of dollars are being repriced every day. Three signals to track before 10:00 AM on May 20: VCB's reaction in the first 30 minutes, whether the VN-Index closes above or below 1,900–1,905, and total traded value by 10:00 AM. The combined outcome of those three indicators will reveal whether the market is absorbing external pressure in a controlled way or beginning a broader decline.