


On the morning of May 19, Nikkei 225 rose 0.9% while KOSPI fell 1.4%. Two major Asian indices moved in completely opposite directions, not because of a shared macro shock or a regional sentiment shift, but because of their underlying sector structures. Each index tracks a different economy and responds to a different type of data. VN-Index closed at 1,927.94 on May 18, and when you look at which logic governs it, the answer clearly leans toward Japan.Vietnam News
Japan's GDP Beat: Nikkei Responding to Its Own Data
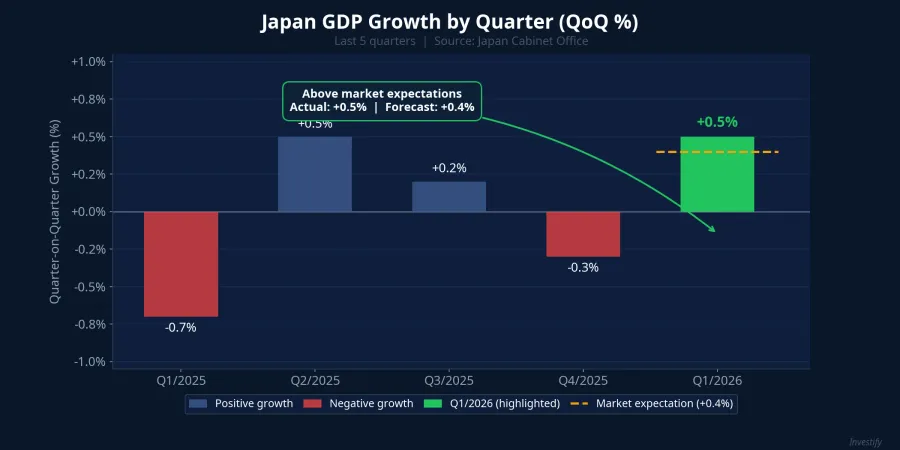
On the morning of May 19, Japan's Cabinet Office reported Q1/2026 GDP grew at 2.1% annualized, a sharp improvement from the 0.3% recorded in Q4/2025. On a quarter-on-quarter basis, growth came in at 0.5%, beating the 0.4% forecast from a Reuters economist survey.CNBC This isn't a technical revision. It's a signal that Japan's economy is expanding at a stronger pace than expected, and Nikkei reflected that in the same morning session.
The two main contributing components were household consumption and net exports. Household spending rose 0.3% after being flat in the prior quarter, a component that accounts for more than half of Japan's economy. Net exports contributed an additional 0.3 percentage points compared to zero in Q4/2025. A weaker yen has sustained the competitive edge of auto and machinery exports, which carry the largest weight in Nikkei 225.
The broader picture of Nikkei is a price-weighted index spread across autos (Toyota, Honda), financials (Mitsubishi UFJ, SMFG), retail (Fast Retailing), and industrial manufacturing (Komatsu, Daikin). No single sector holds an overwhelming majority. When household consumption and exports both exceed expectations simultaneously, all these components benefit together, and the index rising is a logical outcome, not a coincidence.
Why KOSPI Fell at the Same Time
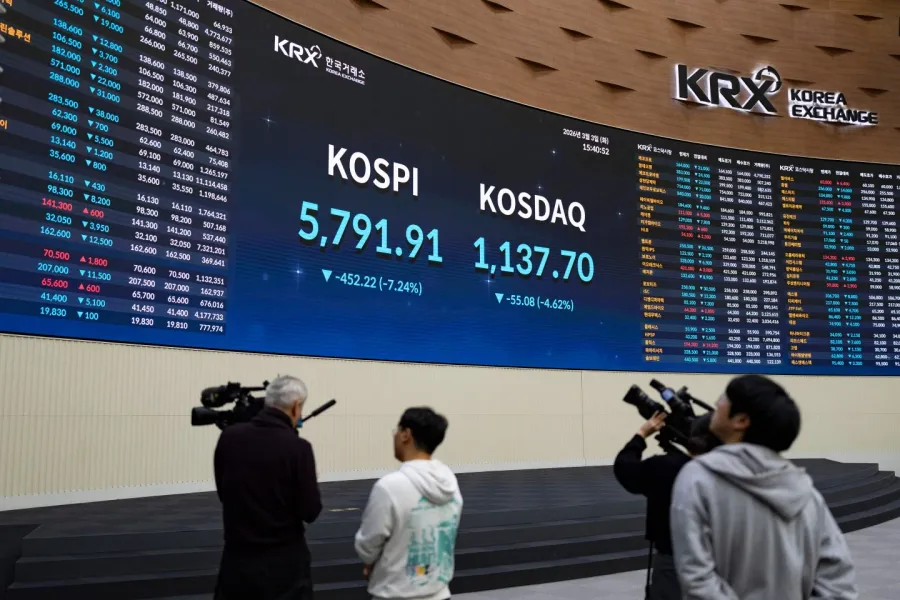
While Nikkei moved higher, KOSPI went the opposite direction for one straightforward reason: extreme sector concentration in semiconductors. On the KOSPI200 index, Samsung Electronics and SK Hynix combined account for 51.5% of total market capitalization, up from 38.7% at the start of the year.Bloomingbit The memory chip group contributed roughly 70% of KOSPI's full-year gains in 2026. This kind of concentration delivers powerful upside when the HBM cycle runs hot, but it is also a double-edged structure when that cycle reverses.
On the night of May 18 (U.S. hours), the Nasdaq fell 0.5% as memory chip stocks corrected. KOSPI opened down 1.4% on the morning of May 19. Japan's positive GDP print was not enough to offset this, because KOSPI doesn't respond to Japan's macroeconomic data. It responds to the U.S. chip cycle. This is the clearest demonstration that reading these two indices through the same analytical lens is wrong from the starting point.
Where VN-Index Belongs: The Structure Answers Itself
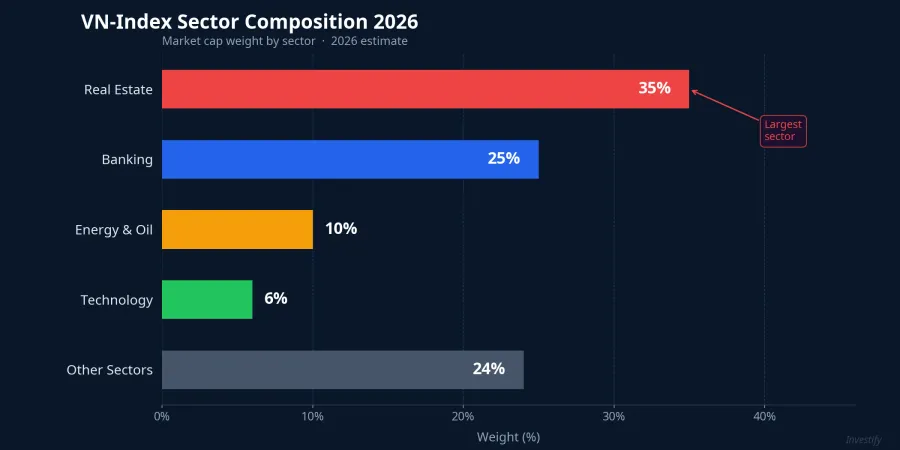
The big picture of VN-Index in 2026 is an index that leans heavily toward the real economy. Real estate accounts for roughly 35% of index moves, with Vingroup, Vinhomes, and Vincom Retail among the top market-cap holdings. Banking contributes another 25%, led by VCB, BID, TCB, and CTG. The energy and oil sector, where GAS holds a market cap of VND 224,400 billion, makes up around 10%.TradingView Technology sits at only around 6%, and here "technology" primarily means FPT, not semiconductor exporters in the mold of Samsung or SK Hynix.
Looking at the MSCI Vietnam index, real estate stands at 39.43% and information technology at 24.37%. Yet that "technology" allocation remains anchored in FPT, not chips. The top 10 stocks account for 62.58% by free-float market cap. VN-Index has concentration levels comparable to KOSPI, but its anchor sectors are real estate, banking, and energy. That structural distinction changes everything about how the index should be read.
The implication: VN-Index responds to macroeconomic data in a way that is far more similar to Nikkei. Credit growth, domestic consumption, energy prices, and lending rates are the direct drivers. The global semiconductor cycle only touches VN-Index indirectly through FPT and a handful of smaller export names. Japan's positive Nikkei signal this morning is genuinely relevant background support for VN-Index. KOSPI's decline is not a direct headwind.
The Variable That Needs Immediate Attention: Oil Reversal on Trump News
There is, however, one important point where VN-Index and Nikkei diverge: domestic oil production. Japan imports nearly 100% of its energy, while Vietnam both produces and refines oil domestically. When oil prices move sharply, Vietnam's oil-and-gas stocks can move against the Nikkei's direction, creating a separate signal layer that needs to be read independently.
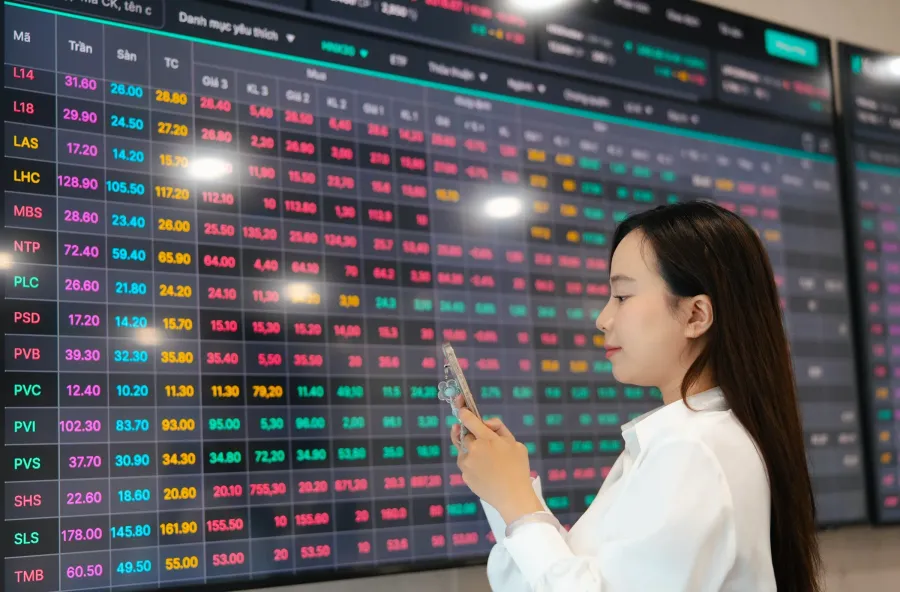
On May 18, the equipment and services subsector of Vietnam's oil-and-gas group led the entire VN-Index with a gain of 3.84%.Tin nhanh chứng khoán BSR closed at VND 33,450, up 5.35%. PLX closed at VND 45,150, up 6.99%. GAS closed at VND 93,000, up 4.03%. PVD closed at VND 35,800, up 6.23%. All four core names posted strong gains, reflecting market expectations for sustained high oil prices amid ongoing geopolitical tensions in the Gulf.
At the same time, Brent crude closed May 18 at $107.76 per barrel, down 1.37%, after reports emerged that U.S. President Donald Trump had postponed plans for a military strike on Iran.CNBC On the morning of May 19, Brent continued to trade near that level. An important distinction applies here: the 5-7% surge in oil-and-gas stocks on May 18 reflected expectations of a prolonged high oil price environment, not any change in actual business results. When geopolitical risk de-escalates even partially on the Trump delay news, that expectations premium can unwind. That said, Brent remaining in the $107-108 range is still sufficient to keep BSR's refining margins positive and PVD's drilling service margins stable at a fundamental level.

Three Signal Layers to Watch at the Open
Given this structure, three signal layers are worth tracking from the opening bell on May 19.
Layer one: how oil-and-gas stocks react to softer Brent. If BSR, PLX, and PVD open in positive territory despite the oil decline, that is a signal that capital is comfortable with current valuations and remains positioned for continued geopolitical premium. If profit-taking hits these names hard right at the open, the May 18 rally carries more of a short-term trading character than a fundamental shift.
Layer two: the banking sector's behavior. This is VN-Index's largest real-economy component. If VCB, BID, and TCB advance in tandem, the index is being lifted from its primary anchor rather than depending on a single cyclical group. A strong banking session would confirm that VN-Index is absorbing the positive Japan macro signal, not just riding oil momentum.
Layer three: foreign investor flows. Last week, foreign investors sold a net VND 4,000 billion. When Nikkei rises on a Japan GDP beat, regional capital tends to rotate back toward markets with similar structural profiles. VN-Index is a candidate on that list, and any reversal of foreign selling would be the most direct confirmation of the structural thesis laid out here.
Reading VN-Index in Its Own Language
Two Asian indices going in opposite directions this morning is not a contradiction that needs resolving. It is evidence of a fundamental principle: each index is a product of its own sector architecture, not a reflection of "Asian markets" as a single uniform entity.
VN-Index must be read in the language of the real economy: real estate, banking, energy. Japan's positive GDP data is genuine background support for today's session. Brent crude's price action is the variable to manage within the trading day. And the most important signals to confirm VN-Index's direction don't come from Seoul. They come from what VCB and BSR do at the opening auction.
Key signals worth monitoring over the coming week: May credit growth data, Brent crude's trajectory ahead of a final U.S. decision on Iran, and Japan's April CPI figures expected at the end of the week.