

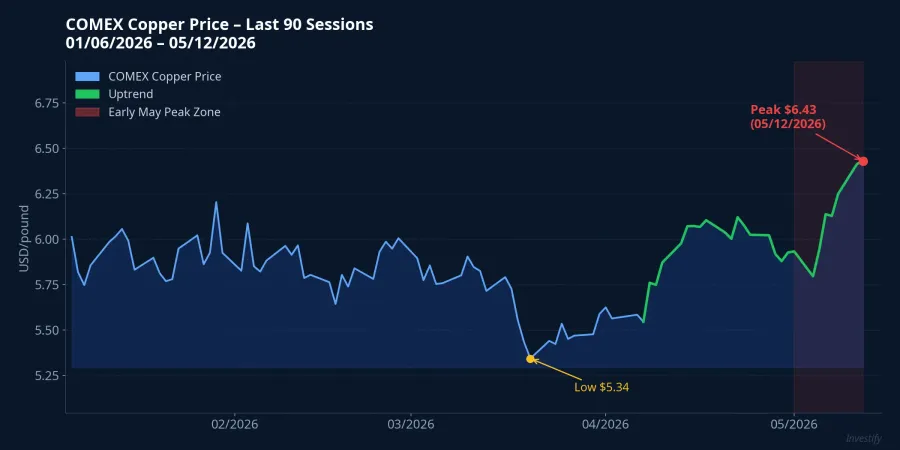
On May 11, 2026, LME three-month copper settled at $13,943 per tonne, surpassing the previous record of $13,618 set on January 29 of this year.Mining.com On COMEX, the front-month contract closed at $6.43 per pound the following day. The 2.7% single-session gain was the largest intraday swing in over a month.
Financial media reacted almost immediately with a familiar frame: the "AI boom" is driving copper demand through data centers, so of course copper is breaking records. That reading is not entirely wrong, but it explains only a small slice of what is actually happening. The bigger picture points to three structural forces that are far heavier than AI, all converging at the same time.
Power Grid Infrastructure: The Overlooked Driver
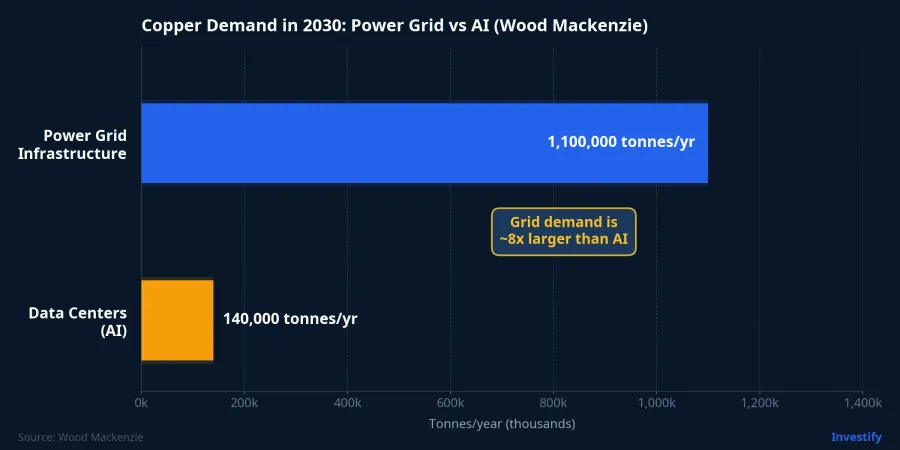
Wood Mackenzie's data tells a story that barely shows up in the technology press.Tom's Hardware
Grid infrastructure alone is projected to consume 1.1 million tonnes of copper per year by 2030, driven by transmission network upgrades, transformer installations, and the integration of renewable energy sources into national grids. Over the entire 2026–2030 period, global data centers are expected to consume approximately 700,000 tonnes of copper in total, or roughly 140,000 tonnes per year. The power grid eats about eight times more copper than data centers every single year.
Zooming out further, Wood Mackenzie forecasts total global copper demand will rise 24% to 42.7 million tonnes per year by 2035, amplified by four structural disruptors: the energy transition, electric vehicles, data infrastructure, and industrialization in emerging markets.PV Magazine Data centers account for less than 3% of that projected growth. AI is a contributing factor, not the primary driver.
The Grasberg Shock: When the World's Second-Largest Copper Mine Went Down
The second driver — more consequential than AI — is the largest supply disruption since the pandemic.
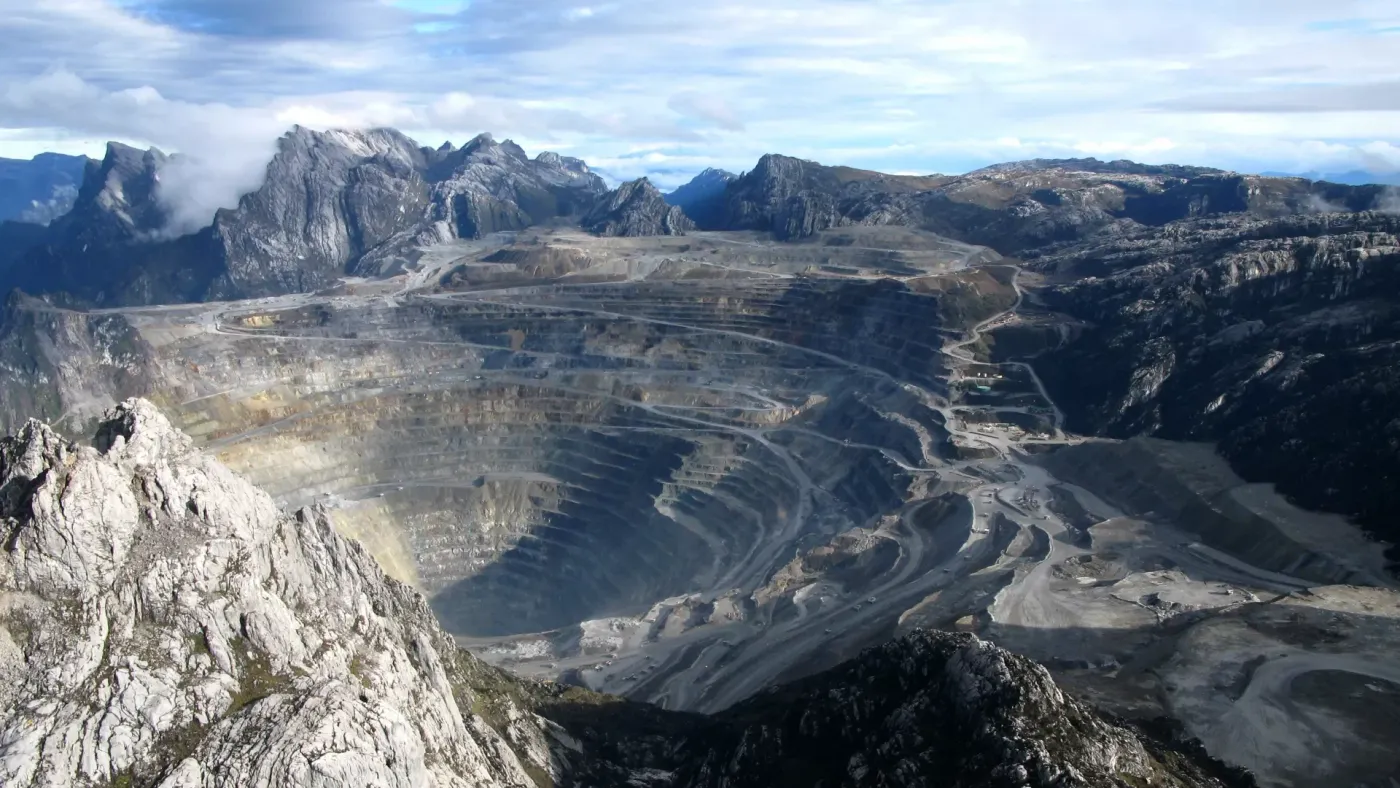
On September 8, 2025, Grasberg in Papua, Indonesia, the world's second-largest copper mine operated by Freeport-McMoRan, suffered a major incident. Approximately 800,000 tonnes of wet material flooded the Block Cave underground section, killing two workers and leaving five missing.Fastmarkets Freeport-McMoRan declared force majeure across all commercial partners.
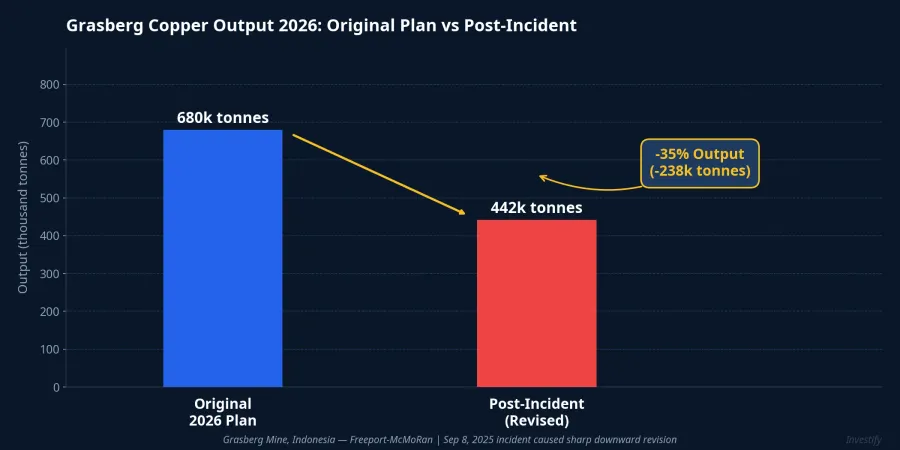
The market consequences were immediate and concrete. Grasberg's 2026 copper output is now expected to fall approximately 35% from its original plan. In aggregate, nearly 600,000 tonnes of refined copper will be absent from global supply between September 2025 and end-2026 due to this one incident.Agmetalminer Freeport subsequently pushed the full restart timeline to early 2028, a full year behind the original commitment.Northern Miner
None of this has anything to do with AI. The Grasberg disruption alone is sufficient to push the copper market into structural deficit through 2026.
Section 232 Tariffs: Trade Flows Artificially Distorted
The third driver is the distortion of US import flows in anticipation of Section 232 tariffs on copper.
From February 2025, American businesses accelerated copper purchasing to lock in inventory before any tariff took effect. In the first half of 2025, US copper imports increased by more than 500,000 tonnes compared to the same period in 2024, pushing COMEX warehouse stocks to a seven-year high.Fastmarkets The COMEX premium over LME prices reached 26.6% in July 2025 — equivalent to approximately $2,596 per tonne — against a five-year average of under 1%.
This artificial pull of physical copper into US warehouses removed a large volume from normal international trading flows at exactly the moment Grasberg was disrupting supply and global grid buildout was accelerating demand. Three forces converging simultaneously, not one AI narrative, is the reading that fits the data.
Silver Confirms the Cycle
Silver's behavior over the same period tells the same story. Silver rose 15.6% in the first week of May, reaching its highest level in two months.MarketWatch Not because of AI, but because of the same clean-energy demand cluster: silver is used in photovoltaic cell contacts, copper in conductors and inverters. When investment in solar panels and renewable grids accelerates, both metals benefit from the same underlying driver.
This is the signature of a structural commodity cycle tied to the global energy transition, not a speculative spike driven by a technology theme. The last time copper and silver entered a sustained joint uptrend for the same reason was the Asian grid expansion in the early 2000s. That cycle ran for years.
Implications for Vietnamese Investors
Getting the narrative right matters because it shapes expectations about how long the trend will last. If this is an AI fad, copper's peak could pass quickly once sentiment cools. If it is a structural cycle driven by grid buildout, the Grasberg supply shock, and tariff-induced trade distortions, prices could stay elevated for several quarters, until Grasberg returns to full capacity and new supply comes online.
For domestic wire and cable manufacturers, raw material cost pressure is the direct issue. CAV (Vietnam Electric Cable Corporation) is the country's leading wire and cable producer, importing copper feedstock from Germany, South Korea, and Singapore. GEE (Gelex Electric), which owns the Cadivi brand, closed May 12 at VND 124,200 per share, down 6.62% after two consecutive sessions of sharp gains. TYA (Taya Vietnam) is a smaller-cap player in the same segment, closing at VND 18,450 per share.
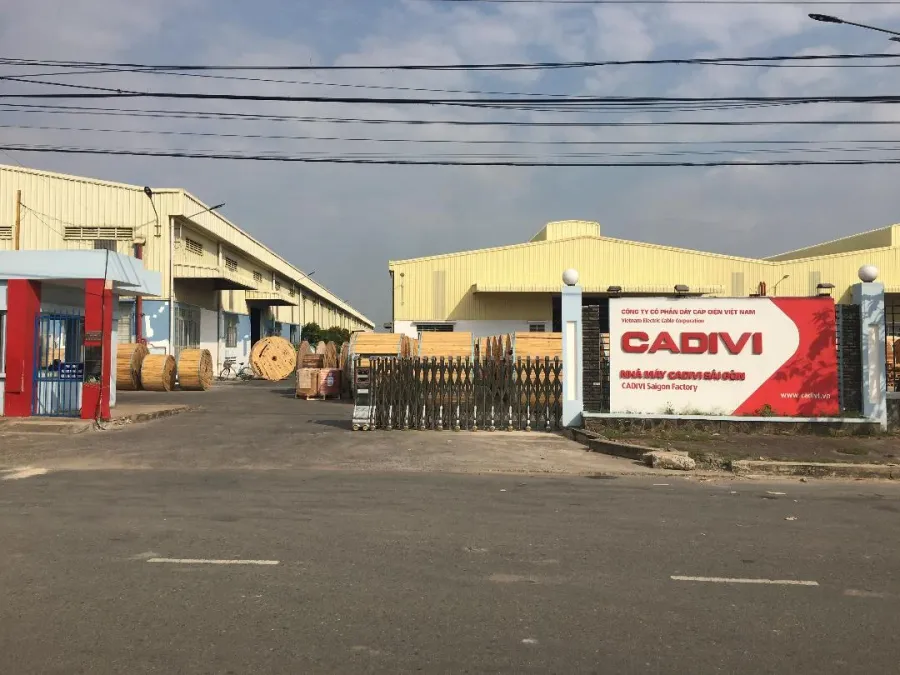
For these companies, gross margins come under direct pressure when copper prices stay high. The ability to pass costs through to customers is constrained by long-term contracts and industry competition. This is an earnings framework to monitor in upcoming quarterly results, not an immediate buy or sell signal.
For individual investors seeking direct exposure to copper, the Vietnam Commodity Exchange (MXV) offers standard copper contracts and smaller-sized contracts suitable for limited capital. MXV is the legal channel with international connectivity and serves as the primary hedging instrument for manufacturing firms exposed to copper price swings.
Three Signals to Watch
The current macro picture is three structural forces reinforcing each other. To assess when the trend might shift, three signals are worth tracking closely.
First: Grasberg's restart timeline. Freeport has moved the date to early 2028, but any further revision — in either direction — will immediately affect global supply-demand balance. Second: the Section 232 investigation. If the US administration does not impose tariffs or provides a clear timeline, the front-loading import wave will subside and the COMEX-LME spread will compress. Third: LME inventory levels. If stocks continue to fall while prices rise, that is confirmation of genuine physical shortage rather than speculative positioning.
All three of these move on a quarter-by-quarter timescale, not day by day. That is precisely why copper's current rally has a different structural foundation from previous price spikes driven purely by AI sentiment.