


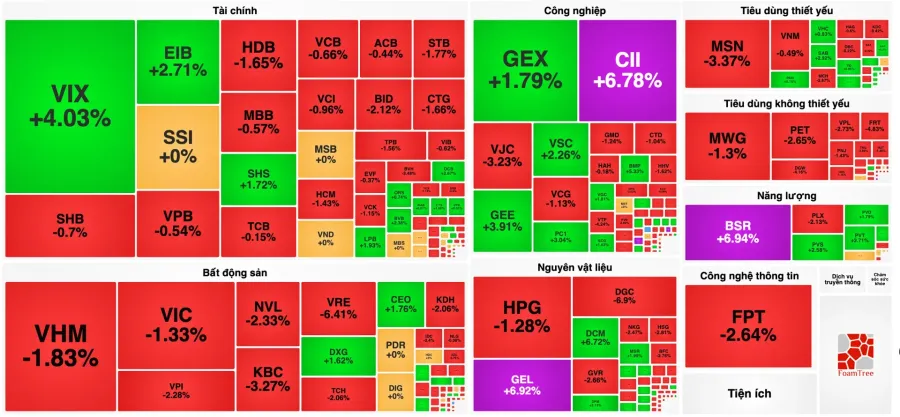
The big picture on May 11 contained a notable contradiction. VN-Index fell 19.87 points to 1,895.50, a 1.04% decline: the first meaningful pullback since the index set its all-time high of 1,915.37 points on May 8.Vietstock In the VN30 basket, 27 of 29 components closed in the red, with only SAB and LPB holding onto gains. Yet total market turnover actually rose nearly 4% from the previous session, reaching approximately VND 29,666 billion.BaoMoi Capital did not leave. Capital rotated.
Technical Correction After Seven Weeks Up
VN-Index had climbed continuously for seven weeks from around the 1,600 level before May 11. A technical pullback after such an extended run is historically unremarkable. What is notable is the magnitude: today's 1.04% decline aligns with the median pullback over the past five years, when the market typically corrects roughly 1.17% before finding a low within three sessions.Vietstock That is historical data, not a guarantee.
SAB (+1.95%) and LPB (+1.93%) were the only two components in the green. Their presence among the gainers suggests today's selling was not driven by a negative story unique to individual stocks, but rather by broad profit-taking after the index had just reached a record close. When 27 of the remaining components all decline in the same session, that points to natural distribution pressure at an all-time-high zone rather than panic.
Which Stocks Dragged the Index
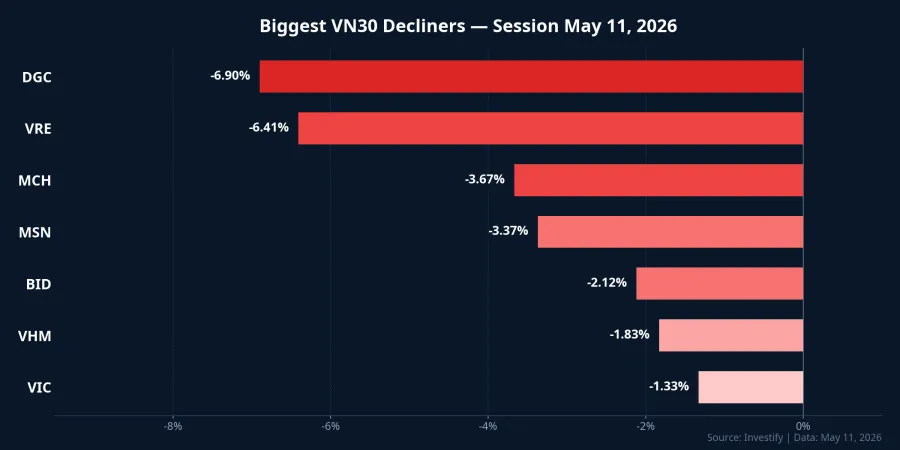
Selling pressure concentrated most visibly on the Vingroup cluster. VIC fell 1.33%, VHM dropped 1.83%, and VRE slid 6.41%. The three Vin-group names alone erased more than 9 points from VN-Index during the session.Dân Việt VRE was the most surprising of the three: a 6.41% decline — far deeper than its peers — pointed to specific profit-taking on the mall operator after a prolonged upward run.
DGC was the session's steepest decliner at -6.90%, followed by MCH at -3.67% and MSN at -3.37%. BID in the banking group lost 2.12%. The distribution of selling pressure — spanning real estate, consumer goods, and banking — is the hallmark of broad profit-taking rather than sector-specific pressure. Foreign investors continued net selling on HOSE, adding further headwinds to large-cap names that are heavily weighted in foreign institutional portfolios.
Where Capital Flowed: Oil and Fertilizer Break Out
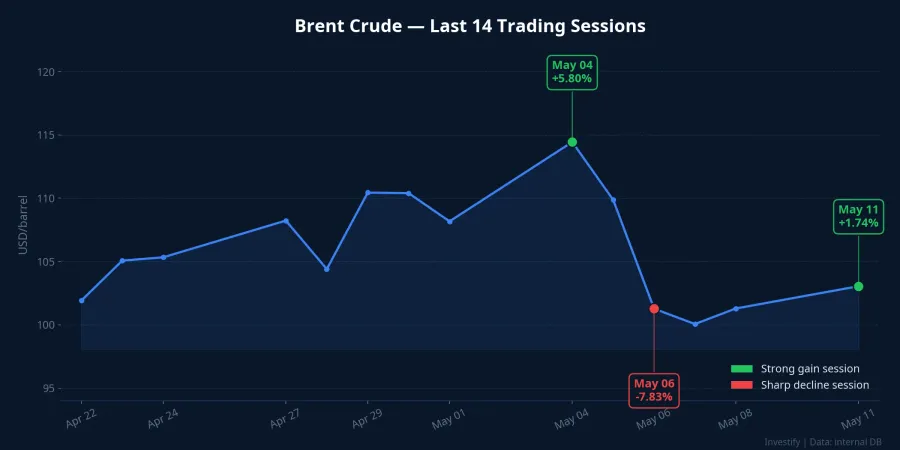
Even as the VN30 finished nearly all red, three stocks hit the daily price ceiling: BSR (+6.94%), GEL (+6.92%), and DCM (+6.72%). All three belong to the oil and fertilizer sectors: industries with direct exposure to global crude prices. The external catalyst was Brent crude closing the May 11 session at $103.05 per barrel, up 1.74%, after the United States rejected an Iranian de-escalation proposal and tanker-escort operations in the Strait of Hormuz continued.

The more revealing story is not one session but the two-week Brent price path: a surge of 5.80% on May 4, a sharp reversal of -7.83% on May 6, then a 1.74% bounce on May 11. Each major Brent swing has corresponded to a comparable flow into or out of Vietnam's oil and fertilizer stocks. Brent is currently functioning as a short-term capital-routing variable for the Vietnamese equity market, in addition to its direct impact on feedstock costs in the fertilizer industry.
What Valuations Say After Q1 Results Season
According to VDSC analysis published after the Q1 2026 earnings season, VN-Index P/E sits at approximately 14x, within the firm's 12.2–14x target range for the next three to four months.Vietstock Stripping out VIC, the rest of the market trades at roughly 11.7x, below the lower bound of that target range. In other words, looking at the market excluding Vingroup, valuations remain reasonably attractive.
From here, the headroom for further gains depends heavily on one variable: Q2 earnings growth. If Q2 results sustain Q1's trajectory, the market has a fundamental basis to recover from current levels. If Q2 profits stall, the 1,830–1,860 zone represents a more defensible valuation floor, roughly where the index found support in April. Current valuations are no longer cheap relative to H2 2025, but they are not stretched enough to warrant outright reduction.
Three Scenarios for May 12 and the Week Ahead
The market's direction from here can plausibly unfold in one of three ways, depending on two key variables: foreign capital flows and Brent crude.
Scenario A: Technical consolidation at the peak. May 11 plays the role of a corrective session after a seven-week rally. Blue-chip stocks recover within one to three sessions, and VN-Index returns toward 1,910–1,915 before searching for the next direction. This scenario aligns with the five-year statistical median (roughly 1.17% pullback, low within three sessions). Three signals to confirm: net foreign selling on HOSE stays below VND 500 billion on May 12; market-wide turnover holds above VND 25,000 billion; and VIC and VHM stop declining further.
Scenario B: Sector divergence, capital rotation into energy. Brent holds above $105 per barrel during the week as Hormuz tensions persist. Domestic capital continues to exit the Vingroup cluster and real estate, flowing instead into oil and gas (BSR, PVS, PVD), fertilizers (DCM, DPM), and coal power (HND, NT2). The VN30 drifts sideways or lower while mid-cap energy names sustain their momentum. Key signal: geopolitical news from Iran within the next 48 hours, and Brent closing above $105 for two consecutive sessions.
Scenario C: Sustained foreign net selling. If net foreign selling exceeds VND 1,500 billion per session for two to three consecutive days, the USD/VND exchange rate faces additional pressure and VN-Index could pull back toward the technical support zone at 1,830–1,860, the former April high from which the market previously recovered. This is the scenario that calls for more explicit defensiveness. Signal to watch: foreign net selling consistently above VND 1,500 billion on HOSE across multiple sessions.
What May 12 Will Reveal
The statistical evidence supports Scenario A as the higher-probability outcome: a roughly 1% pullback after a record high typically does not last more than three sessions, and today's turnover signal — capital staying in the market — is constructive. The risks underpinning Scenarios B and C are both tied to specific external variables: Hormuz geopolitics and the intensity of foreign selling. Absent a surprise in either, the market has a basis for stabilization over the next two to three sessions.
Three concrete signals to track on May 12: net foreign turnover on HOSE, the opening behavior of VIC and VHM, and where Brent is trading as the Asian session begins. Those three data points will indicate which scenario is forming.